***This article is relevant to Data Center Insights license holders based in North America***
Data Center is divided into two main sections: Networks and Insights.
These two systems serve different purposes, and so the way they handle your data can sometimes give you different results. For example, an event may tell you that it contains 300 Customers when viewed through an Insights dashboard, but if you built a Customer List of all of the contributing segments in Networks, that number might show as 275 Households.
Variations like these can happen for a multitude of reasons, and it may not mean that either figure is wrong.
Below us a diagram showing the flow of Data through our system.
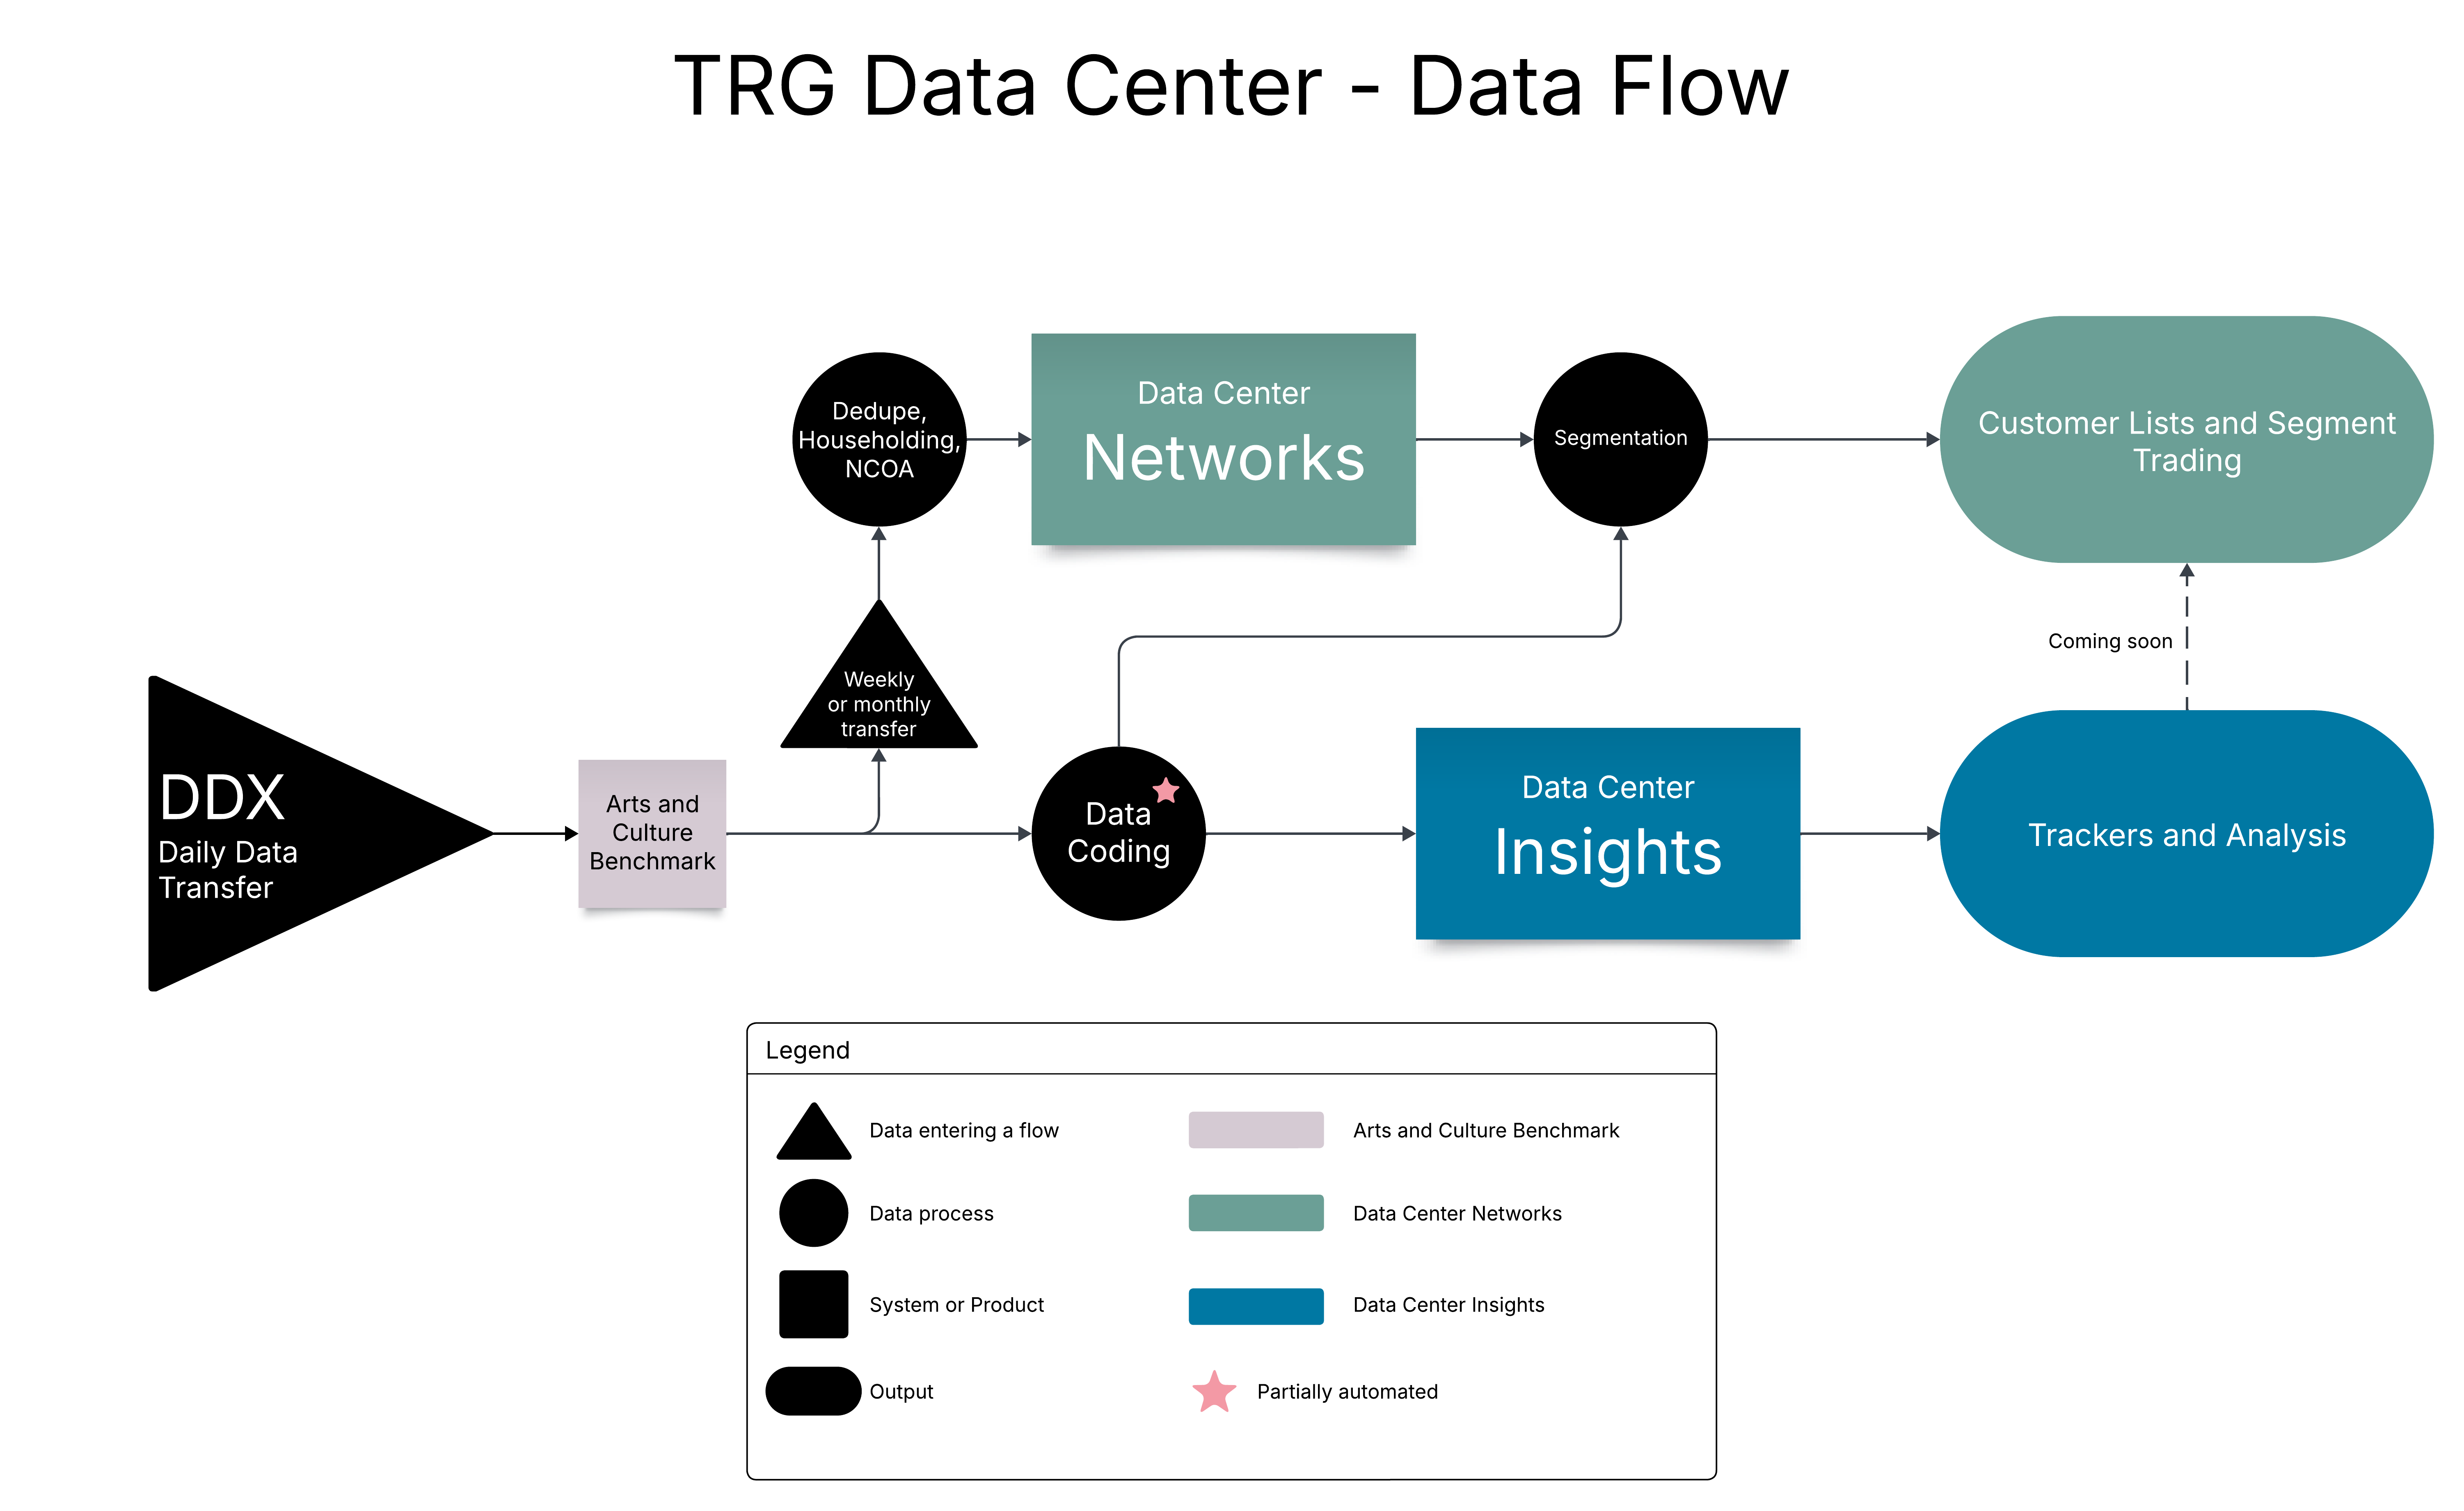
Click to enlarge
After your data is used for the Arts and Culture Benchmark dashboard, the flow splits and the data is duplicated across the two main systems.
Insights
The data for the Insights section of Data Center comes straight from your DDX connection and should be identical to the data stored within your ticketing system. However, to ensure that we are able to analyse your data in a consistent and useful way, we categorise the data in a way that standardises the output.
If you wish to know more about Data Coding, you can find out more here.
Networks
Data within the Networks portion of the system is updated on a weekly or monthly basis, depending on your contract.
Upon import, this data undergoes an in-depth householding and deduplication process, ensuring that accounts with matching last names and addresses are aggregated. This result of this is that, when sending out marketing data, fewer addresses receive multiple copies of marketing material, helping to optimise your marketing spend.
We also run the data through our NCOA records to ensure the details you have for that individual are correct.
Once the data is in the system, the Data Coding values created for Insights is used to define your Segments, meaning that, whilst the Household numbers in Networks may differ from the Customer numbers in Insights, the segments are always based on the same transactional categorizations.
Main Differences
Data Center Networks |
Data Center Insights |
| ⚫ Weekly or Monthly data uploads | ⚫ Nightly data uploads |
| ⚫ Householding and dedupe process optimises counts for Marketing activities | ⚫ Customer counts are based on the data pulled directly from your ticketing system |