Executive Summary – Key Findings
- Ticket sales and associated revenue for orchestras in the U.S., while showing some signs of recovery, are still lagging significantly behind pre-pandemic levels. For the last 12 months (November 2020-October 2021), orchestra ticket revenue is down 67%. This is on par with results for the larger performing arts sector in the U.S. for the same period.
- The greatest ticket gains took place in the late spring and early summer of 2021 when vaccine rates were steadily climbing, and many orchestras put 2021-22 season subscriptions on sale before the Delta variant took hold.
- The picture is more positive on the donation side, with donation revenue for the last 12 months up 23% from the same period in pre-pandemic times. These results are outpacing donation results for the performing arts sector more broadly.
- Many brand-new patrons to orchestras are making their first financial transactions as donors as opposed to the more traditional “on-ramp” of ticket purchase/concert attendance. The number of gifts from first-time patrons has grown by 15% during the last 12 months. This could be the result of a wide range of factors including donation asks associated with viewing digital programming and funding mission-driven, resiliency efforts.
- During 2020, active ticket buyers and donors of orchestras became somewhat less diverse, both generationally and racially. In 2021, however, active ticket buyers and donors mostly returned to pre-pandemic levels.
- As orchestras approach the halfway point of the 2021-22 season, it is evident that many past ticket buyers are still not ready to return to live performances. Orchestras may need to put more resources into selling the overall experience of attending a live concert. This includes highlighting both the joys of attending and safety attributes within the concert hall.
- Orchestras have an opportunity to build new patron bases through donations, recognizing that many patrons are having their first experience with the orchestra as a donor, either for philanthropic reasons or as payment for digital programming. Acknowledging this new activity and inviting these new patrons into a carefully crafted next experience with the orchestra that builds on each patron’s interests could be a highly effective strategy for deepening and sustaining these new and valuable relationships.

Photo: Grant Park Music Festival
Introduction
The COVID-19 International Sector Benchmark (The Benchmark) was created by TRG Arts and Purple Seven to provide real-time intelligence and advice to the arts and cultural sector on the economic impact of COVID-19 on ticket sales and donations and how best to respond. This collaboration brings together Purple Seven’s experience integrating live sales feeds from hundreds of arts venues and TRG Arts’ consulting and data analysis expertise in achieving unsurpassed results for the arts and cultural sector.
TRG Arts and Purple Seven have further partnered with service organizations to track, analyze, and share insights regarding specific genres within the arts and cultural ecosystem. This report focuses on the orchestra field and the partnership TRG Arts and Purple Seven have with The League of American Orchestras. Specifically, this report highlights data from 27, mostly larger-budget U.S. orchestras participating in The Benchmark and how that data compares to the larger data set of U.S. performing arts organizations participating in The Benchmark.
The demographic data shared in this report is informed by the U.S. Census and was accessed through data appends made available via TRG Arts’ relationship with Acxiom and employs Acxiom’s classification labels.
The aim of this report is to compare ticket sales and donations from individual patrons for two specific time periods. The first period tracks the last completed 12 months of the pandemic we’ve experienced, November 2020-October 2021. The second period is an equivalent 12-month stretch from pre-pandemic times, November 2018-October 2019. To provide additional context, this report also compares results from calendar years 2019, 2020, and 2021.
In the U.S., Canada, the U.K. and the Republic of Ireland, cultural
organizations are invited to
sign up for an easy-to-use international COVID-19 Sector
Benchmark Dashboard. An automated data feed between the organization’s box
office and Purple Seven’s secure servers provides a daily
update on ticket sales and donations which is anonymized and
aggregated for The Benchmark. TRG Arts and Purple Seven share new
findings from The Benchmark on a frequent basis.

Two Cohorts
For this study we have analyzed ticket and donations data from 125 U.S. performing arts organizations, including 27 orchestras from budget groups 1-5.
- 11 from group 1
- 2 from group 2
- 6 from group 3
- 4 from group 4
- 4 from group 5
Comparing the 12-month period of November 2018–October 2019 to November 2020-October 2021, these 125 performing arts organizations experienced a 66% decline in ticket revenue and 65% decline in the number of tickets sold.
For the subset of 27 orchestras, ticket revenue is down 67% and the number of tickets sold is down 62%.
On the fundraising side, for these 125 performing arts organizations, donation revenue is up 16%, while associated gifts are down 5%.
For the subset of 27 orchestras, donation revenue is up 23% and gifts are down 6%. See the Appendix at the end of this report for details regarding the revenue and gift numbers that inform these percentages.
Ticket Sales
U.S. Arts Organizations
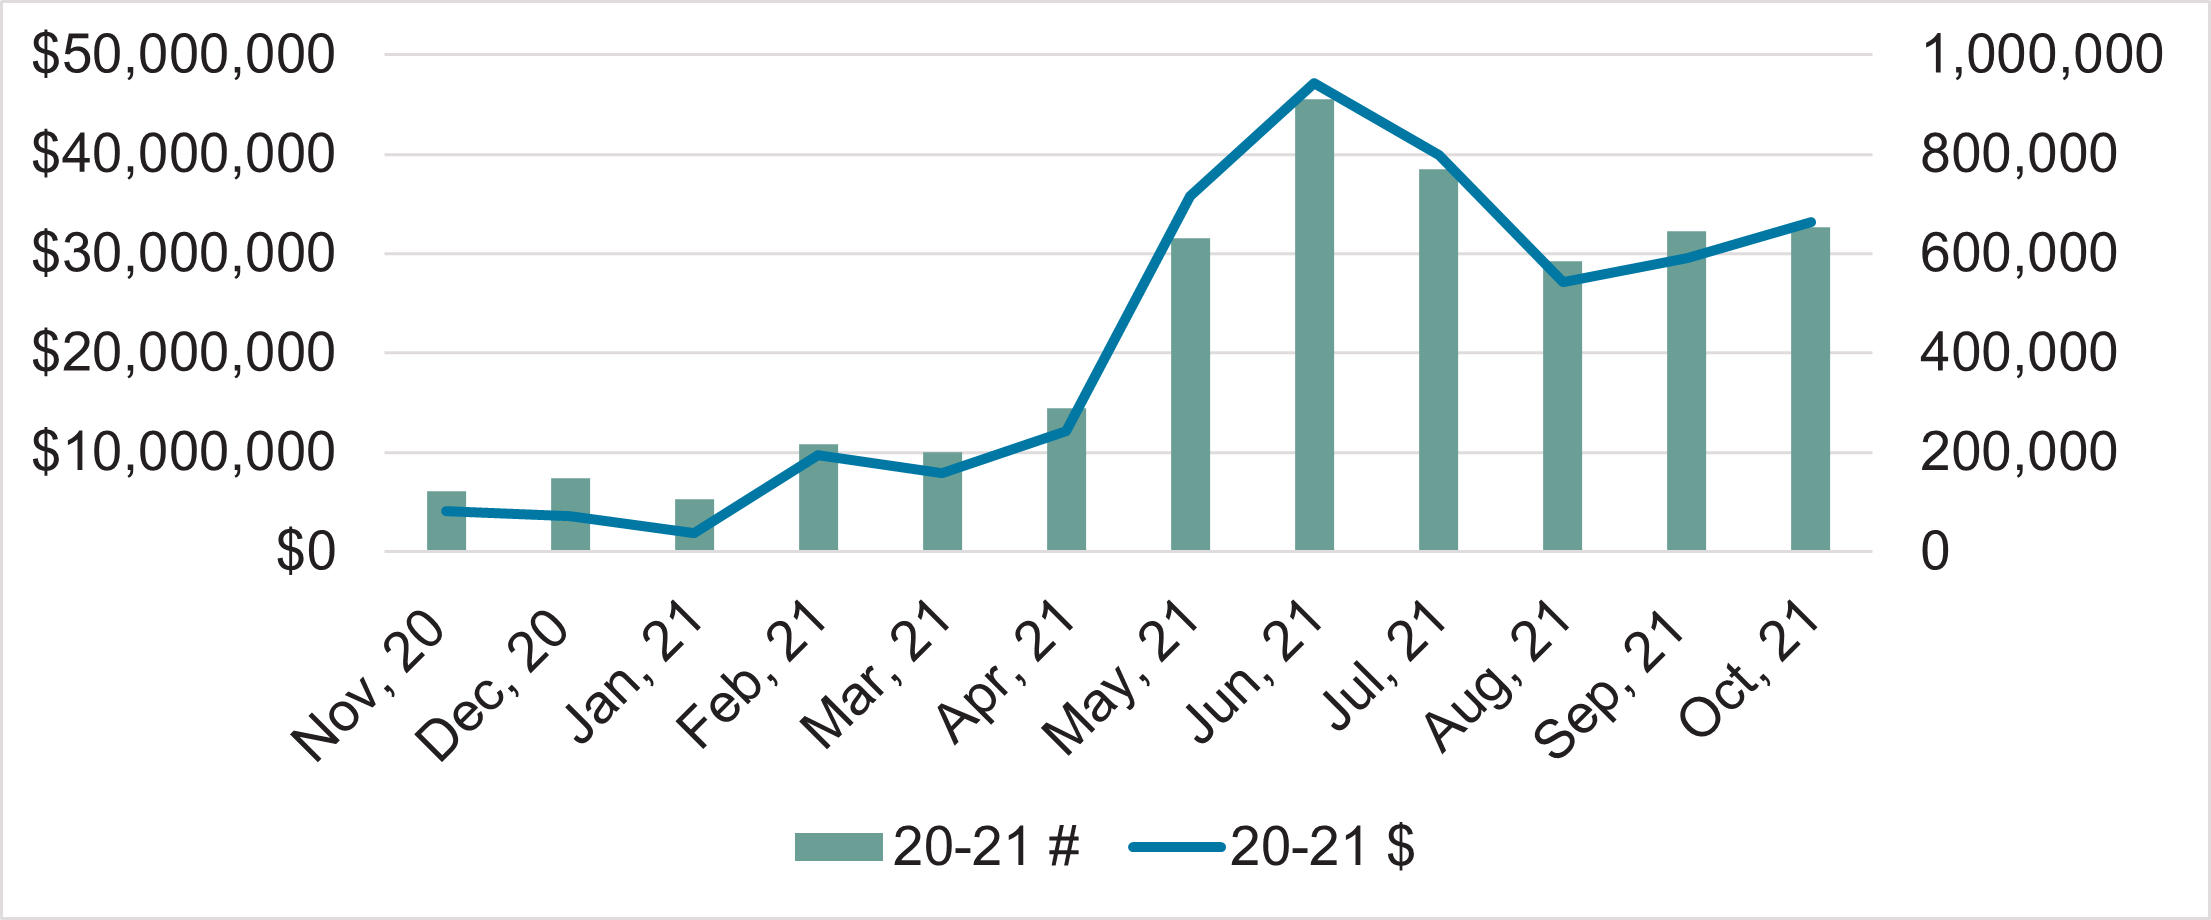
Chart 1 – Monthly ticket sales, gifts, and revenue, Nov. 2020-Oct. 2021.
In the last 12 months, June was the largest ticket sales month. After a dip in July and August, which correlates with the impact of the Delta variant, sales have rebounded slightly in September and October.
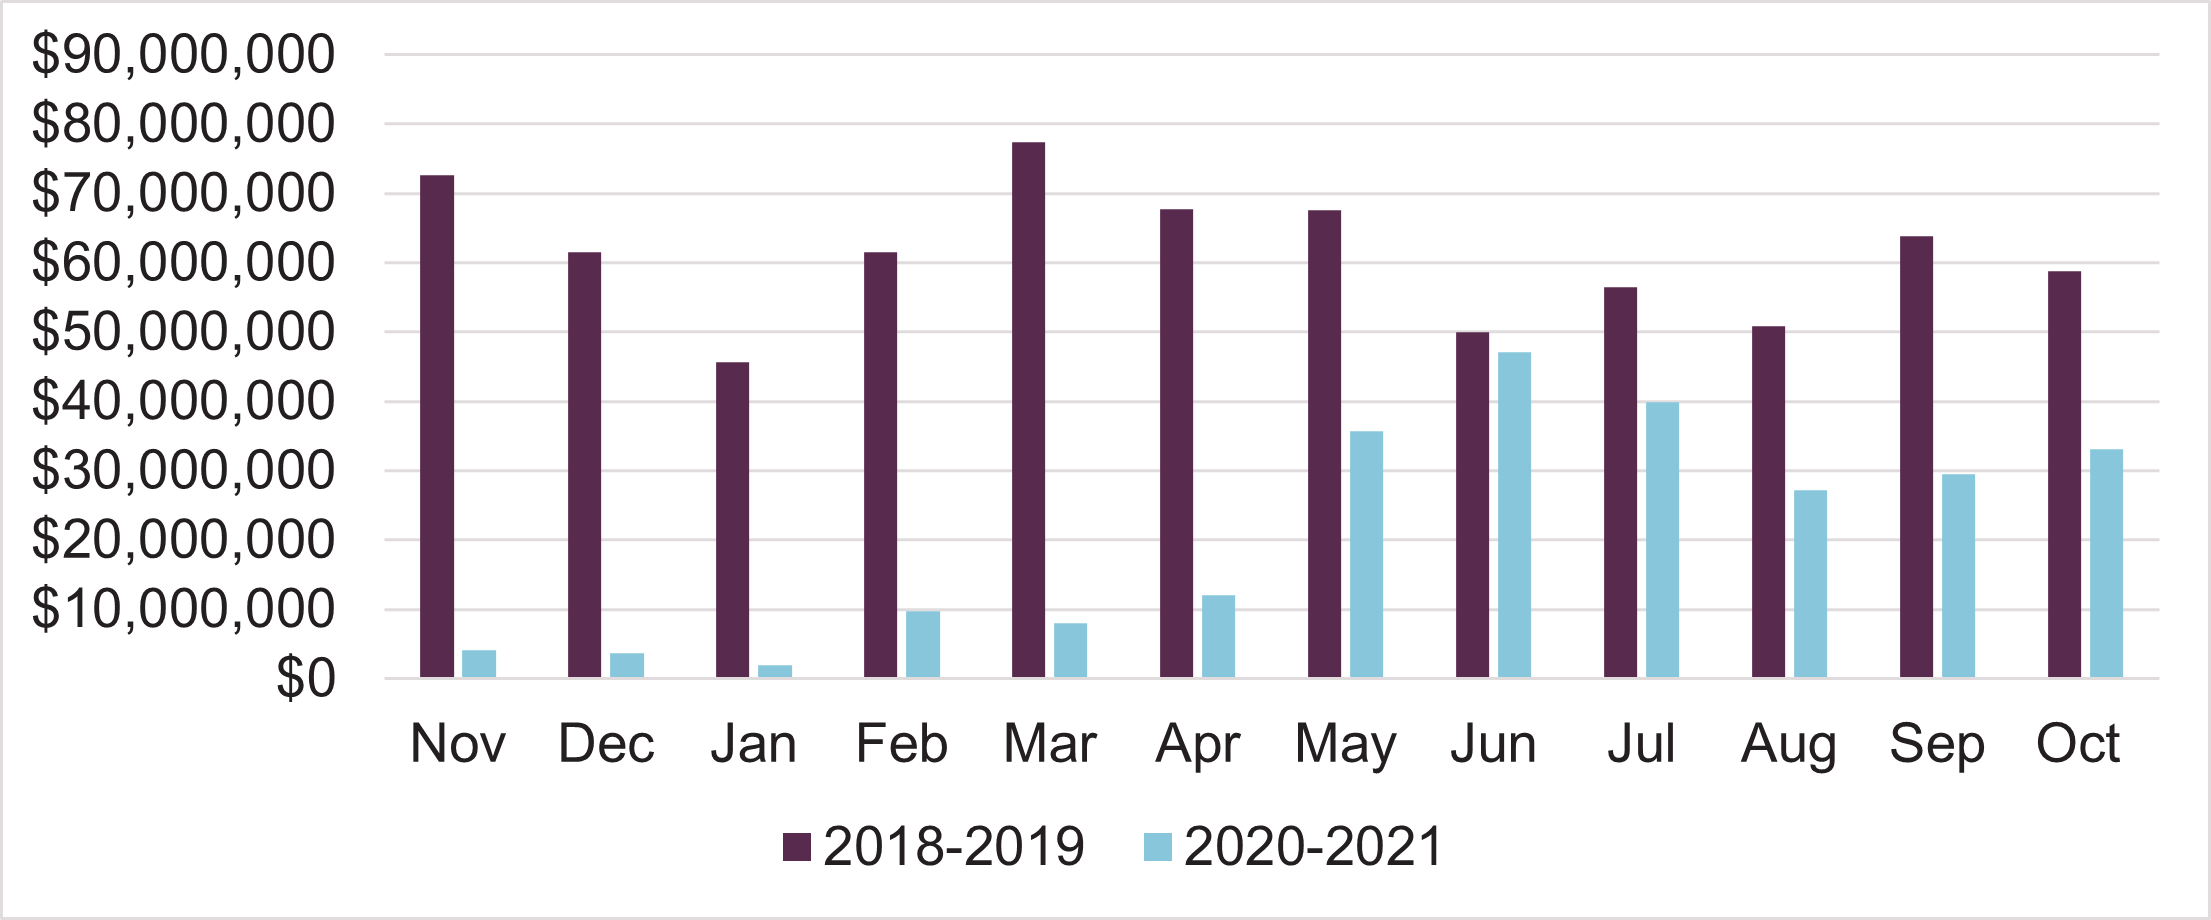
Chart 2 – Monthly ticket revenue from Nov. 2020-Oct. 2021 compared to Nov. 2018-Oct. 2019.
Since the start of the pandemic, no monthly ticket revenue has surpassed the equivalent month’s ticket revenue from 2018-2019.
U.S. Orchestras
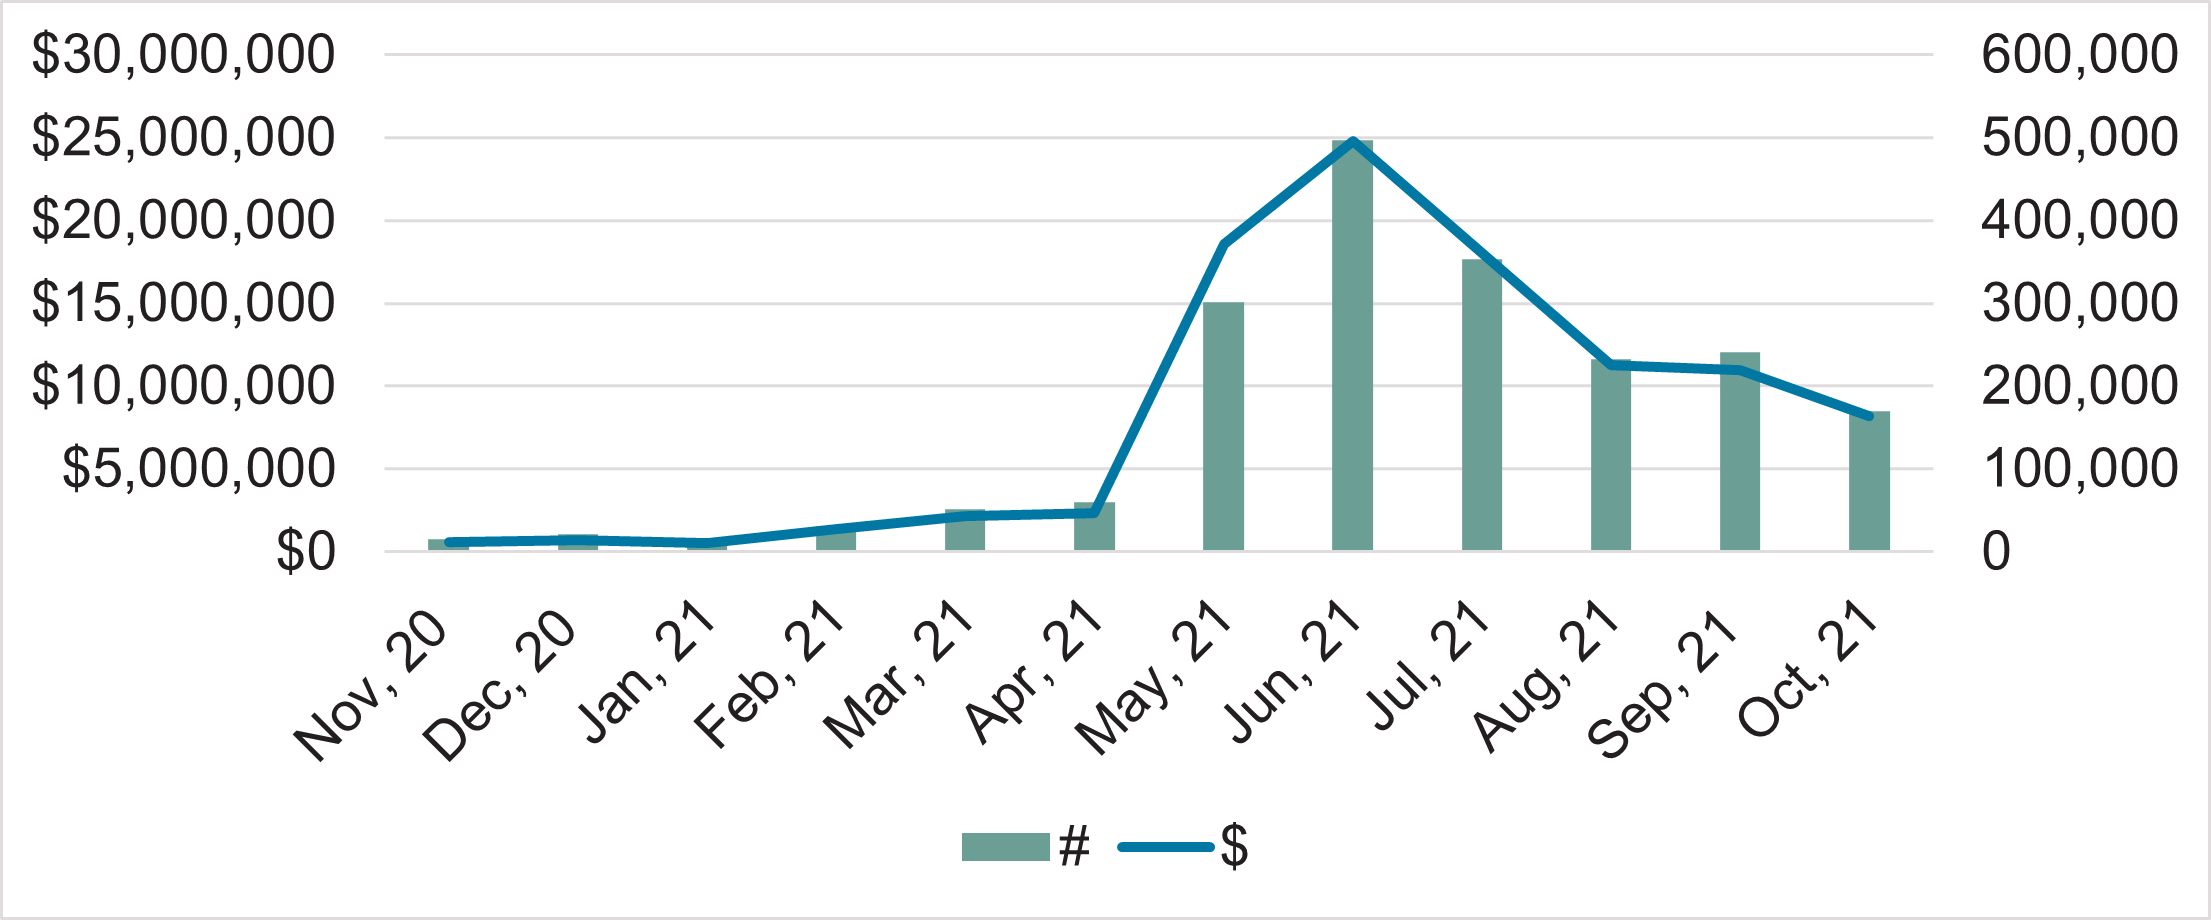
Chart 3 – Monthly ticket sales, gifts, and revenue, Nov. 2020-Oct. 2021.
In the last 12 months, June was also the largest ticket sales month for orchestras. Results in July and August also dipped with a slight rebound in September. In October, orchestras experienced a downturn in ticket revenue from September.
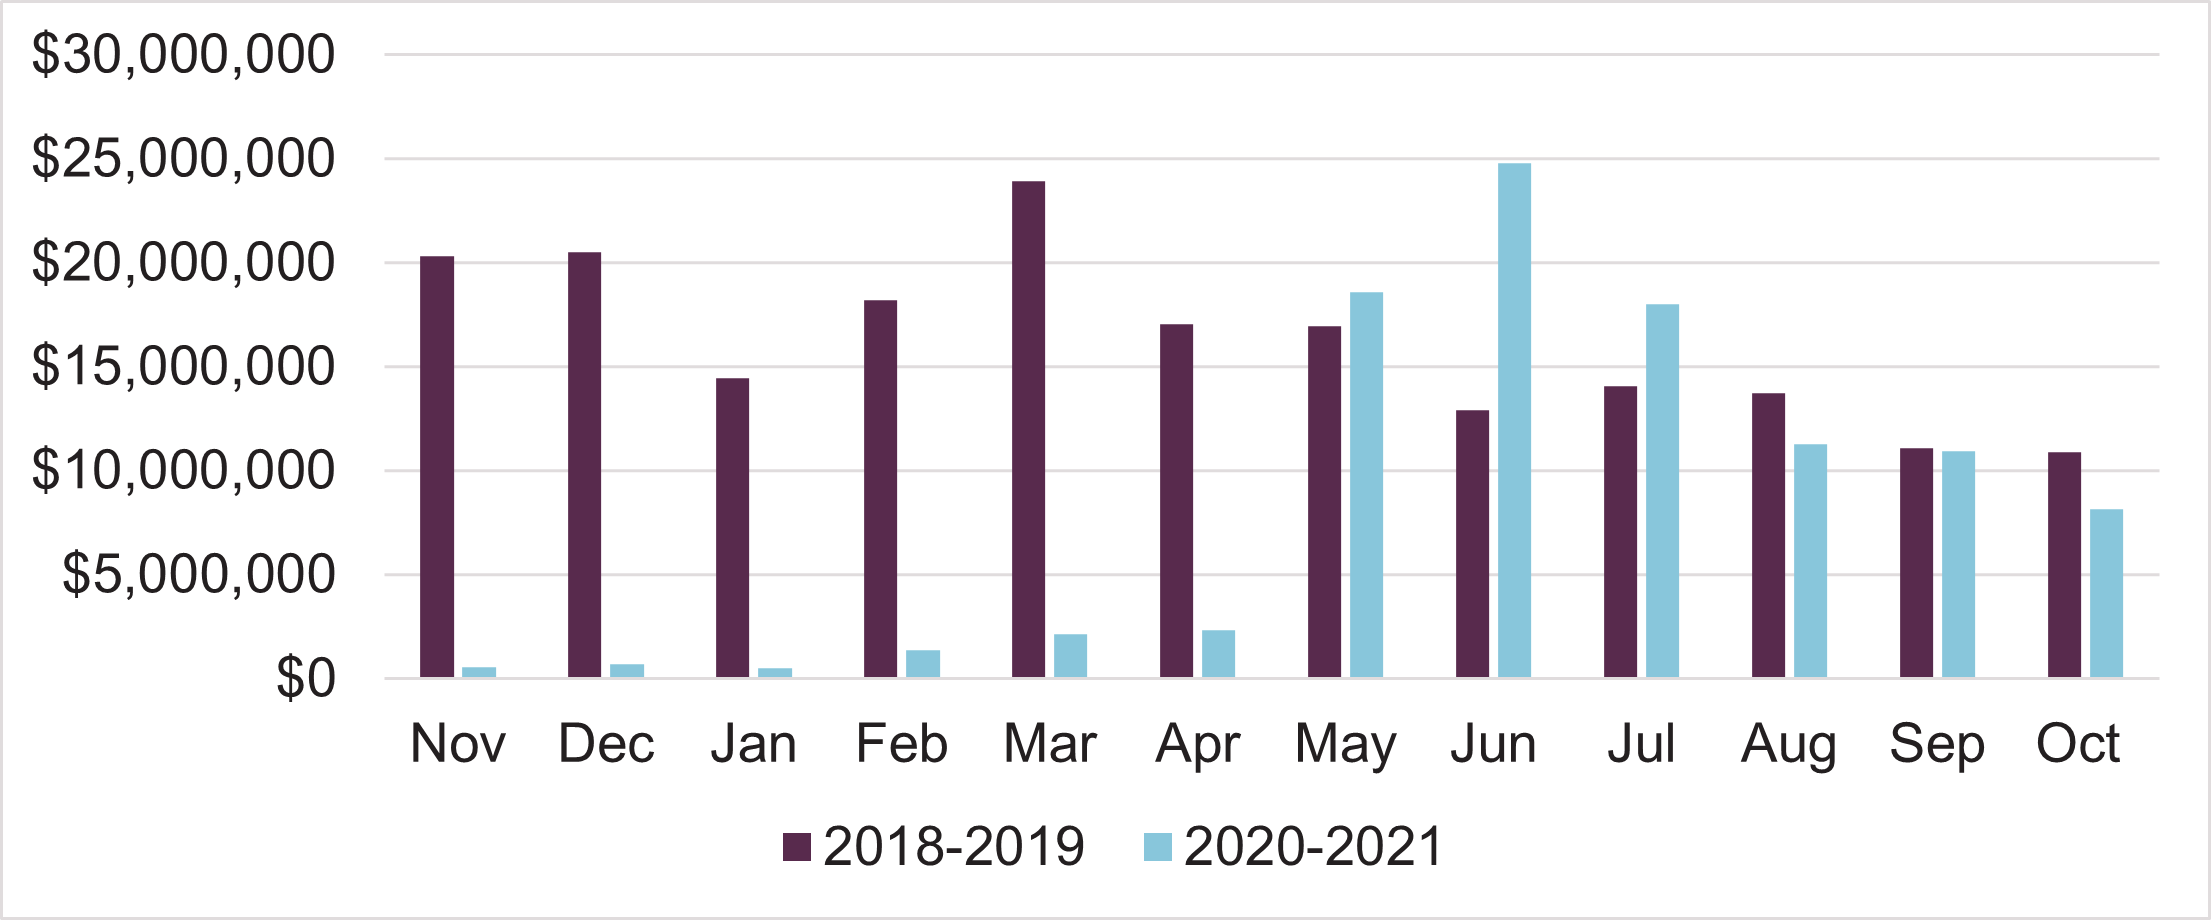
Chart 4 – Monthly ticket revenue from Nov. 2020-Oct. 2021 compared to Nov. 2018-Oct. 2019.
In the last 12 months, 3 months (June, July, and August) outperformed their equivalent month from 2018-2019. These increases correlate with when many arts organizations put their subscription packages on-sale for the 2021-22 season. The late-spring/early-summer on-sale of subscriptions represents a shift from the traditional, pre-pandemic, timing of late-winter/early-spring for the on-sale of subscriptions.
U.S. Arts Organizations
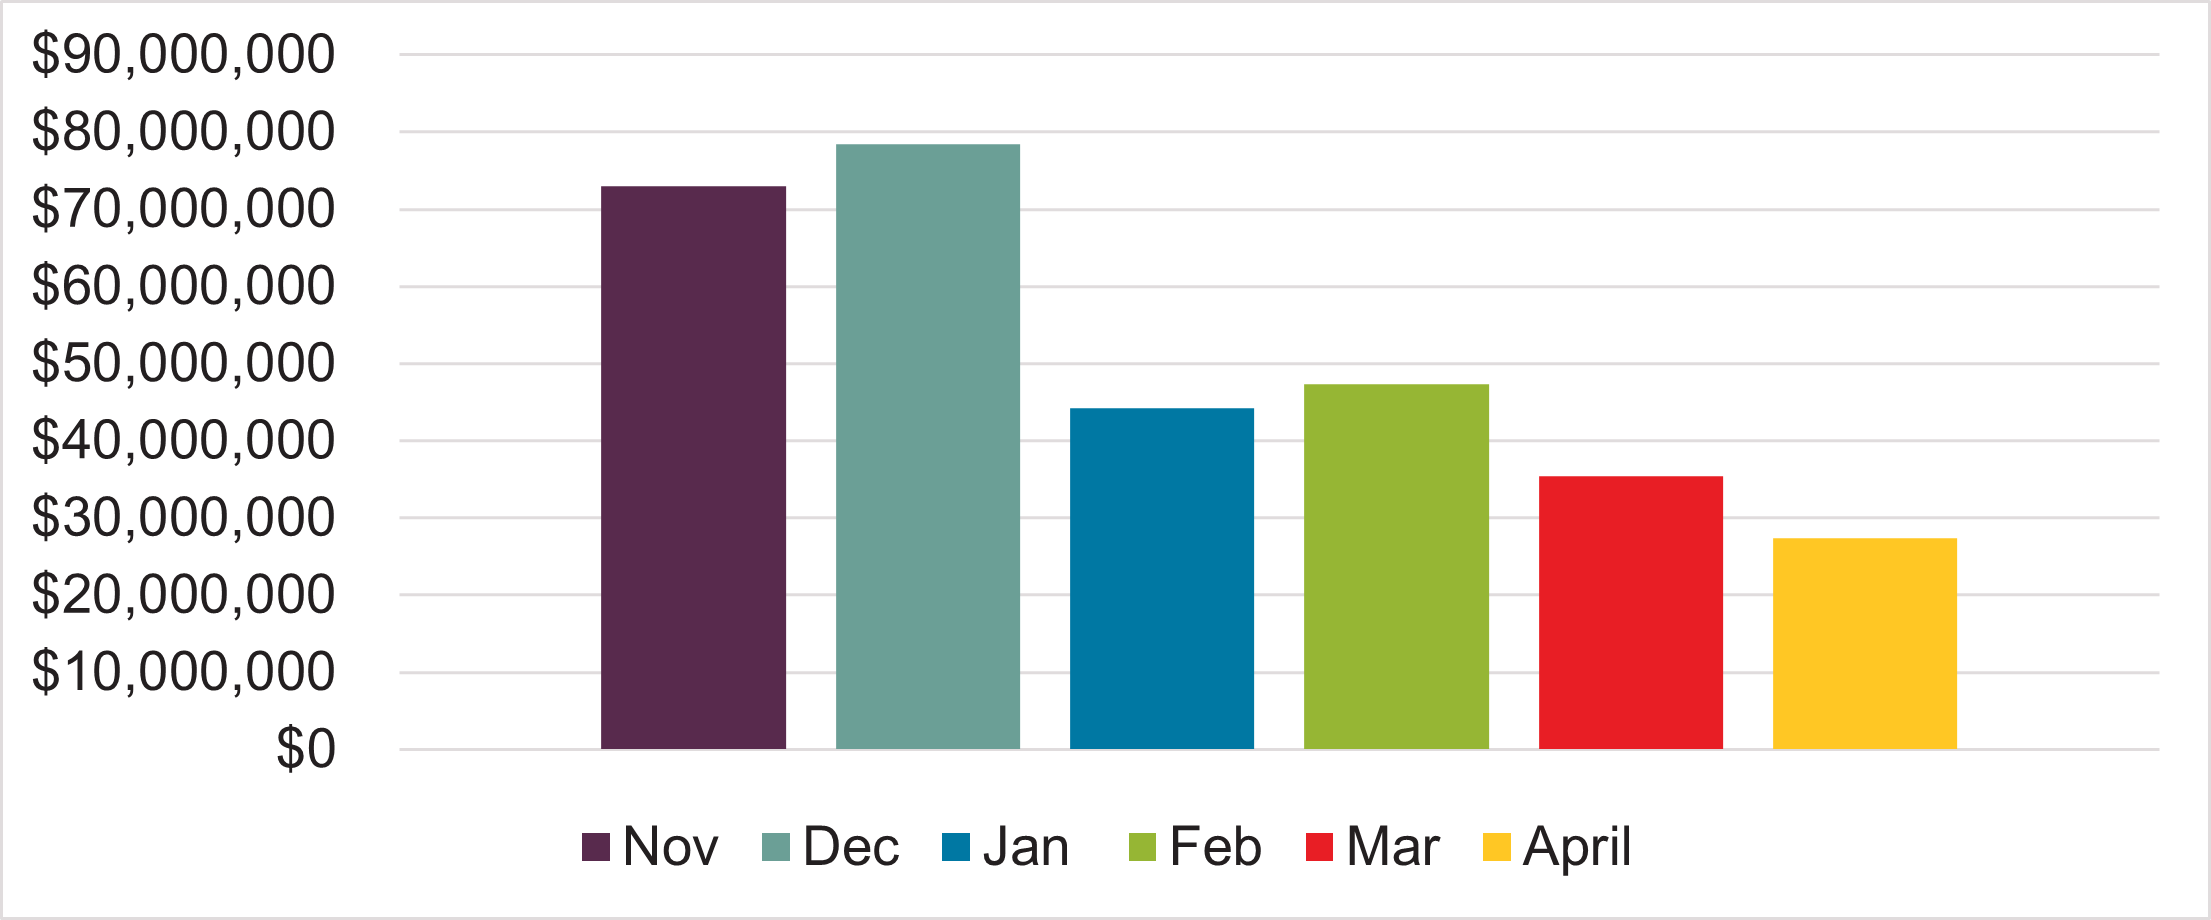
Chart 4 – Monthly advance ticket sales for the next 6 months (Nov. 2021-April 2002).
Advance ticket sales (tickets purchased for future performances) is a good indicator of consumer confidence. To date, December has the strongest advance sales for the next six months.
U.S. Orchestras
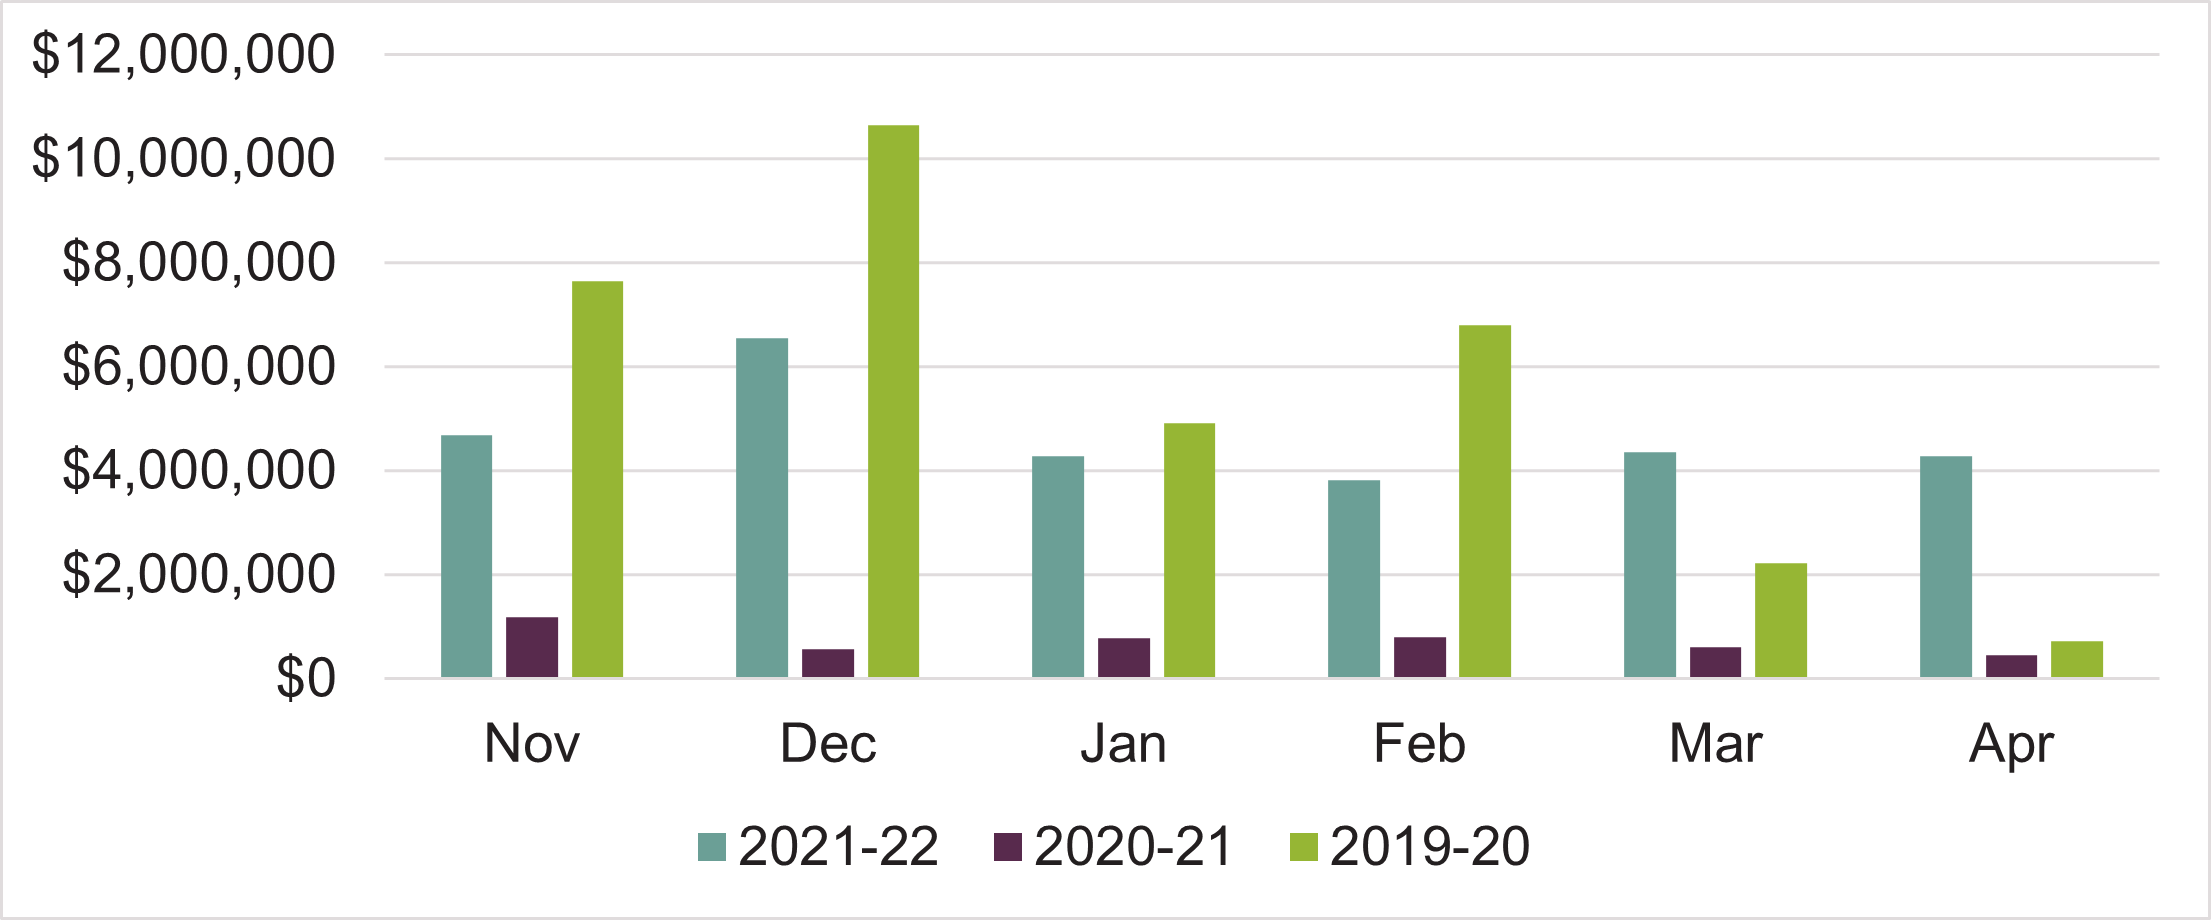
Chart 5 – Monthly advance ticket sales for the next 6 months (Nov. 2021-April 2002), compared to the equivalent months for the last two years.
For orchestras, December of 2021 has the strongest future advance sales, though December of 2021 is tracking behind the advance sales booked by the start of November 2019 for performances in December of 2019. Looking into the future, March and April of 2022 have stronger advances than either of the previous two years.
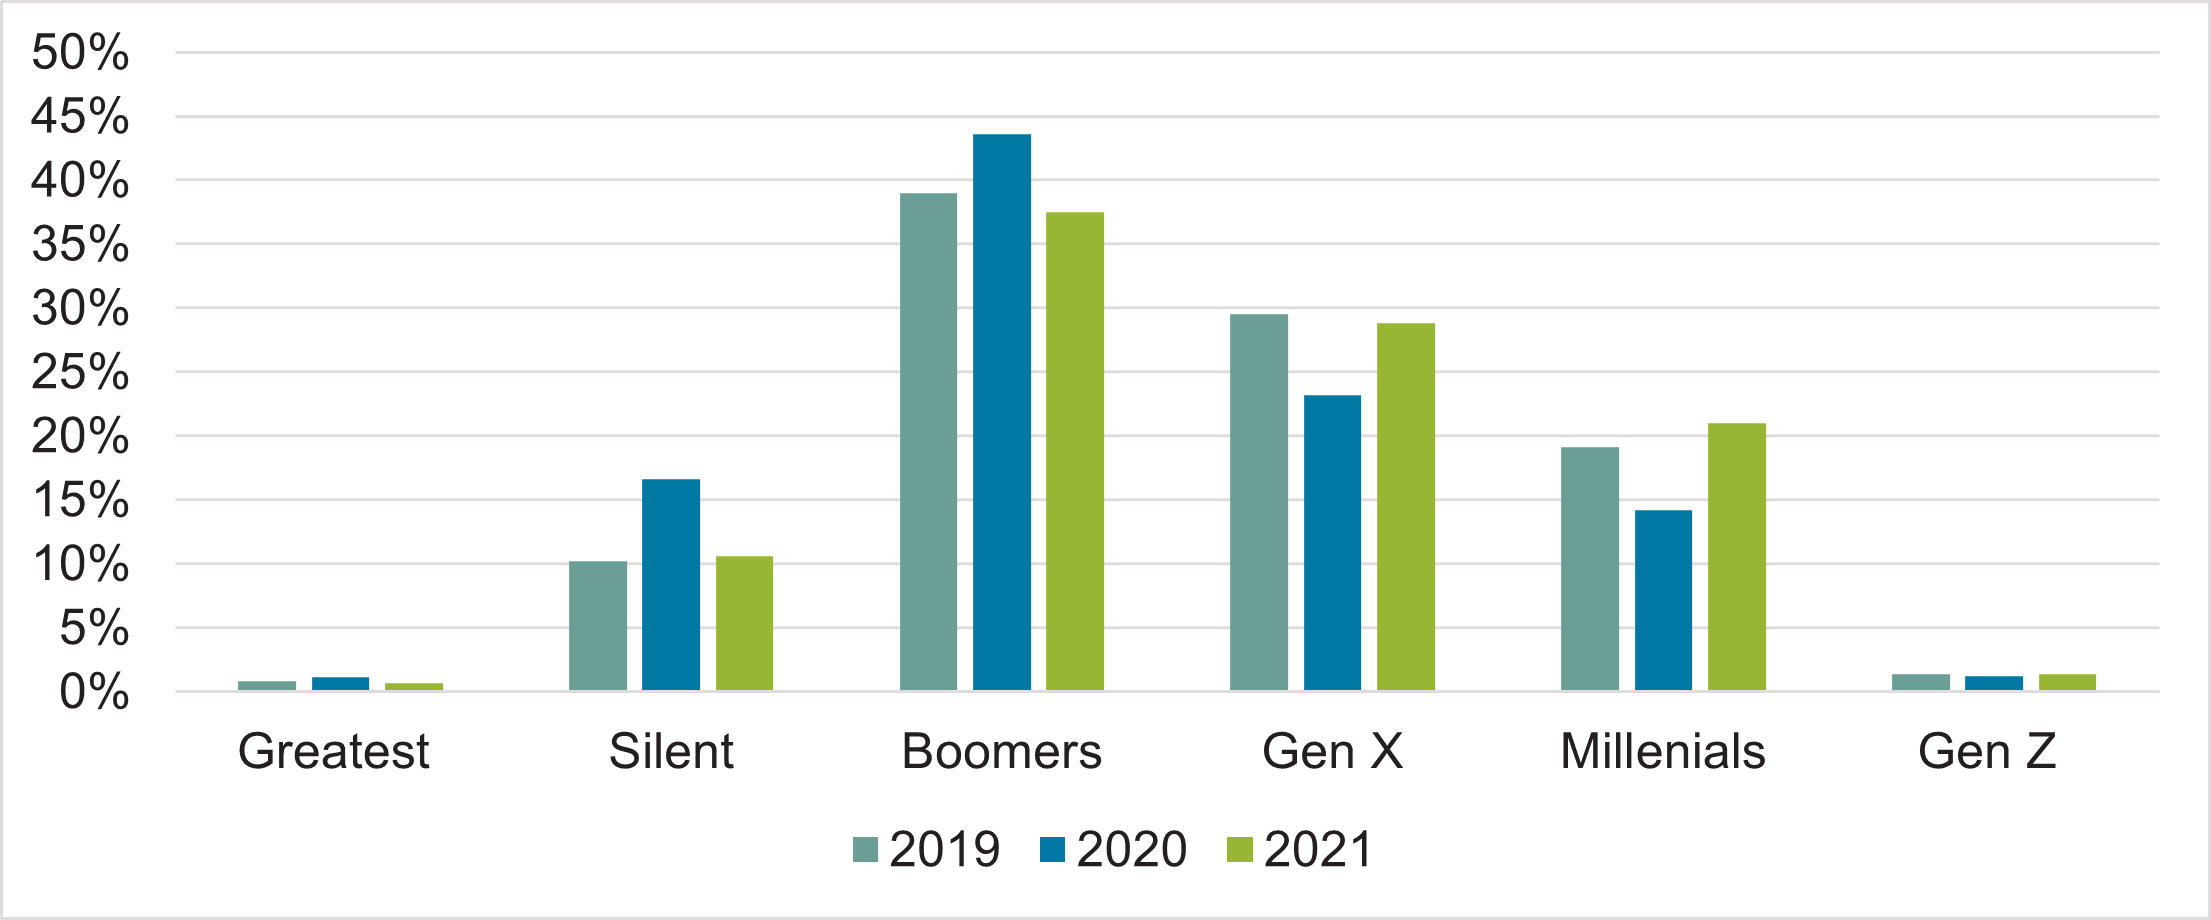
Chart 6 – Tickets purchased by generation for 2019, 2020, and 2021 to-date.
During 2020 the proportion of ticket sales attributed to older patrons, age 55+, increased while the proportion of tickets purchased by younger audiences, under 55, decreased. So far in 2021 this trend has reversed itself and has returned to 2019 levels.
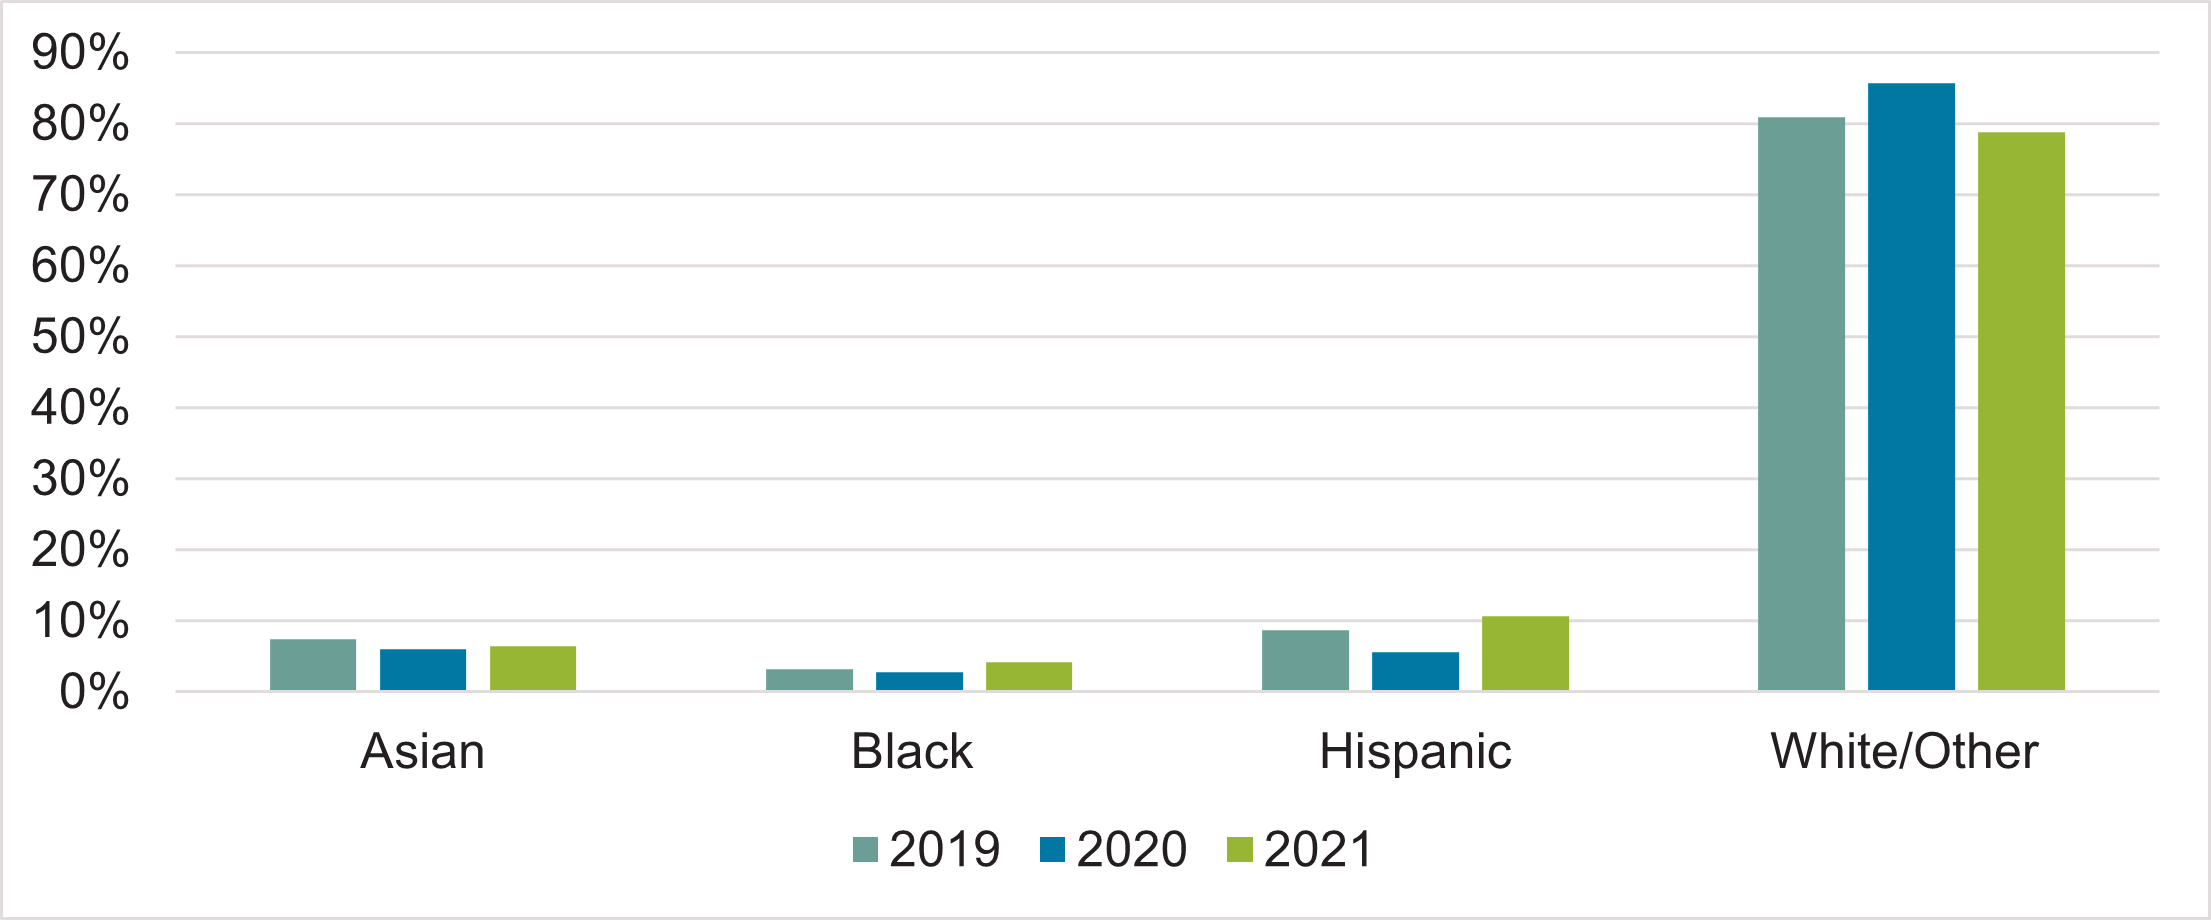
Chart 7 – Tickets purchased by ethnicity for 2019, 2020, and 2021 to-date.
During 2020 the proportion of orchestra ticket buyers became less racially diverse. As with the generational ticket buying trends, 2021 to-date ticket buyers have become, proportionally, more diverse than even 2019.
Photo: Peoria Symphony Orchestra
Donations
U.S. Arts Organizations
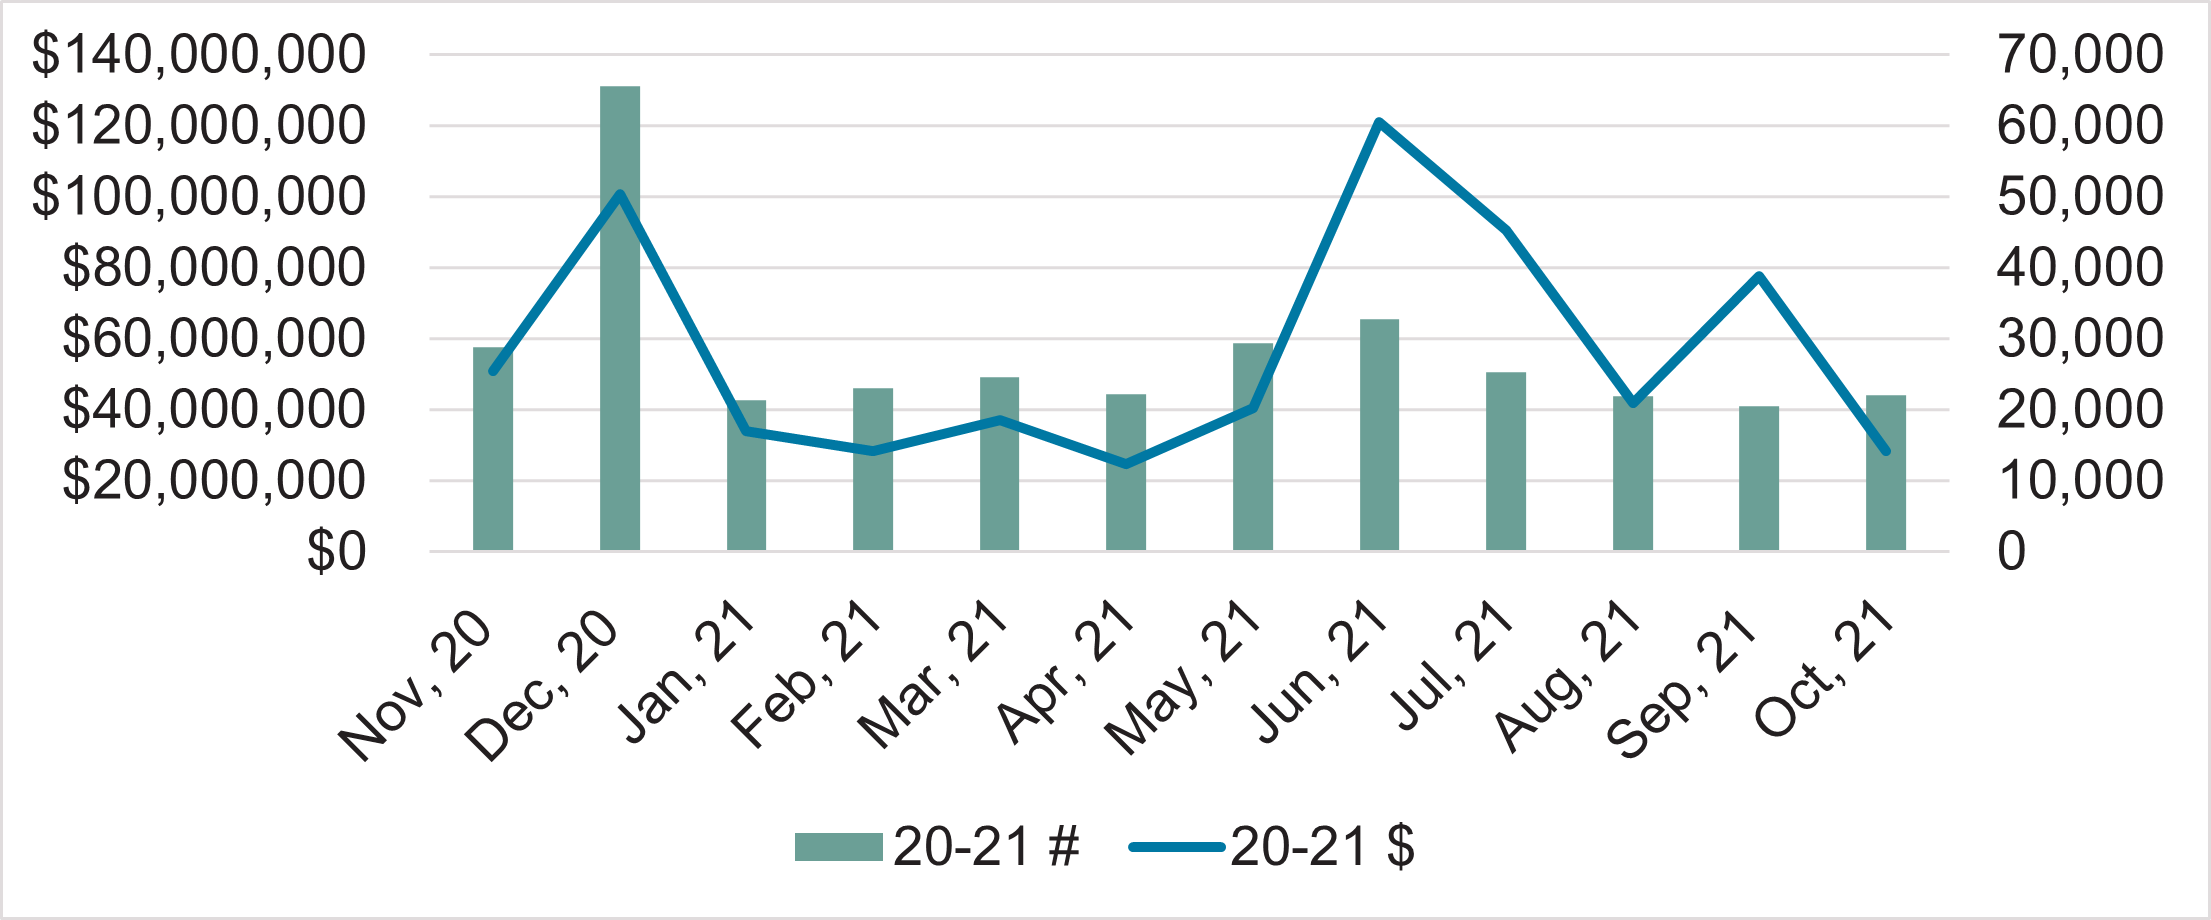
Chart 8 – Monthly donations, gifts, and revenue, Nov, 2020-Oct. 2021.
In the last 12 months, December 2020 generated the largest number of gifts while June 2021 produced the largest gift revenue.
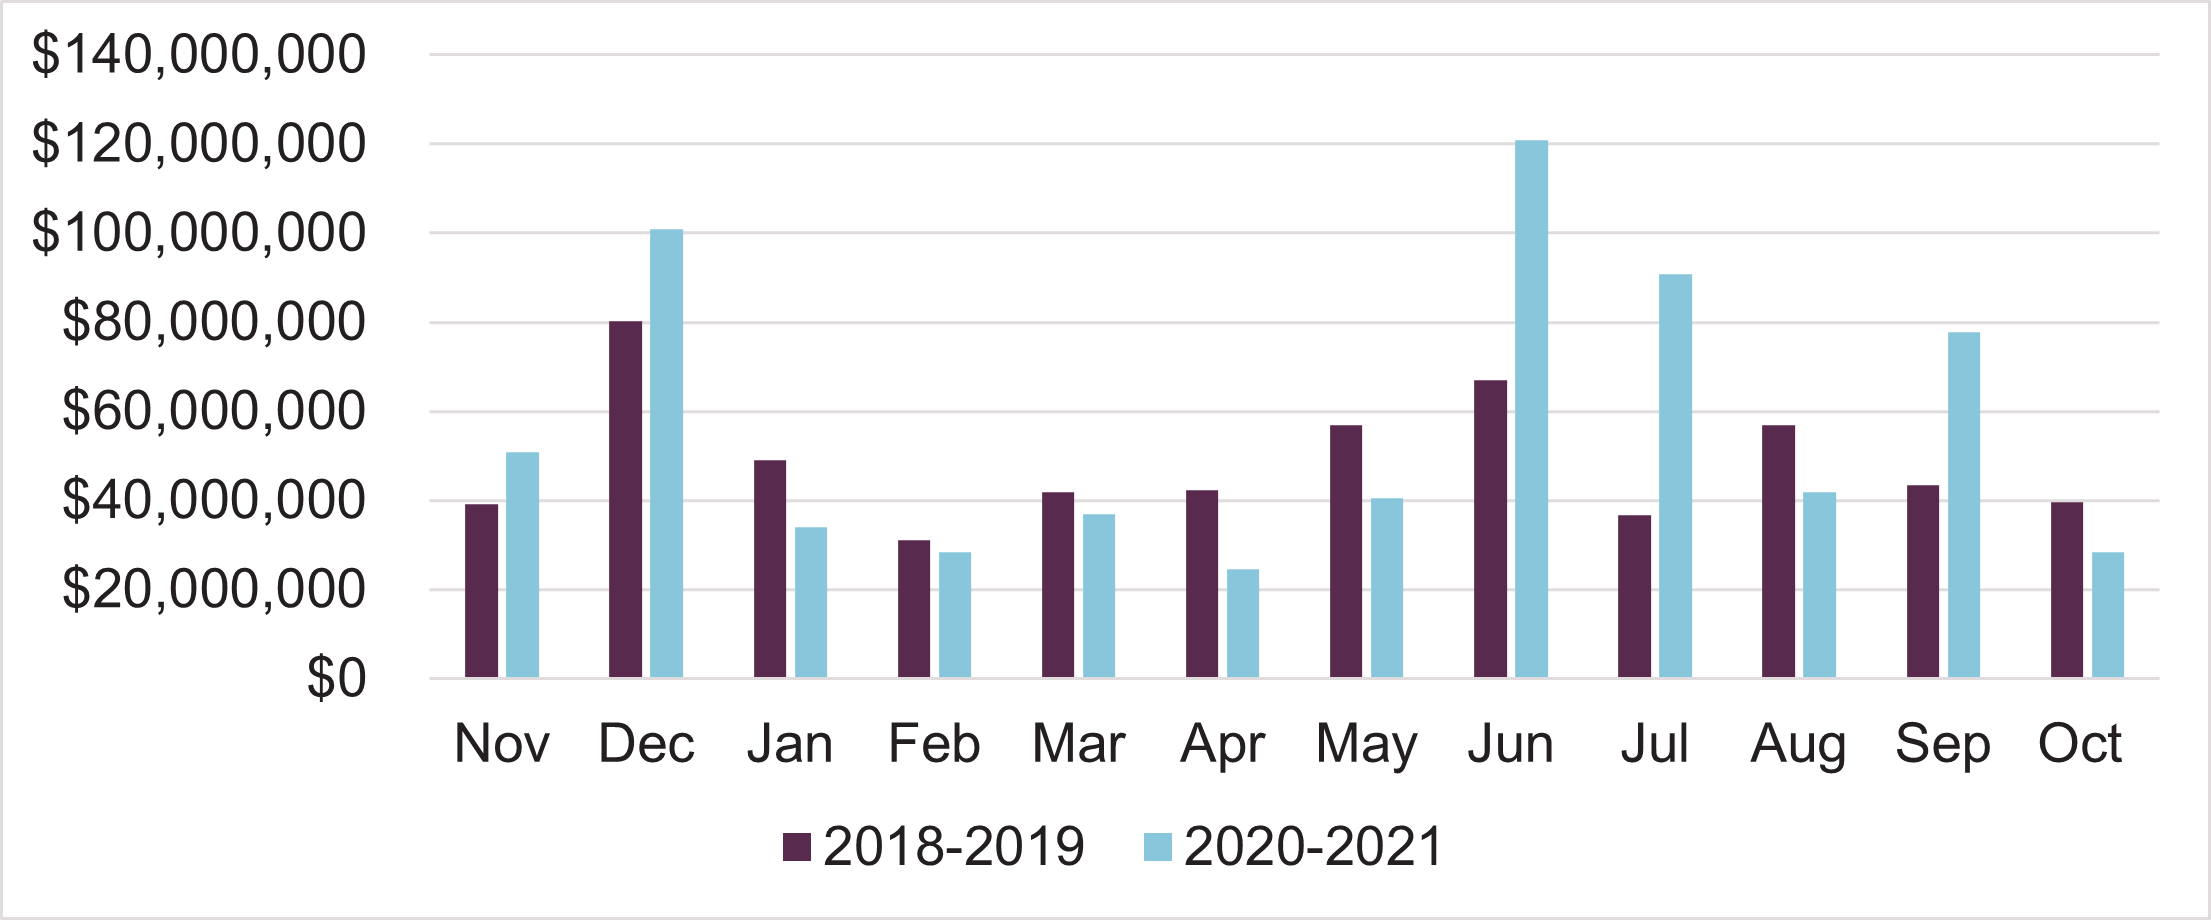
Chart 9 – Monthly donations from Nov. 2020-Oct. 2021 compared to Nov. 2018-Oct. 2019.
In the last 12 months, five of those months outperformed the equivalent months from 2018-2019. June of 2021 produced the largest gift revenue of all the months reported on this chart.
U.S. Orchestras
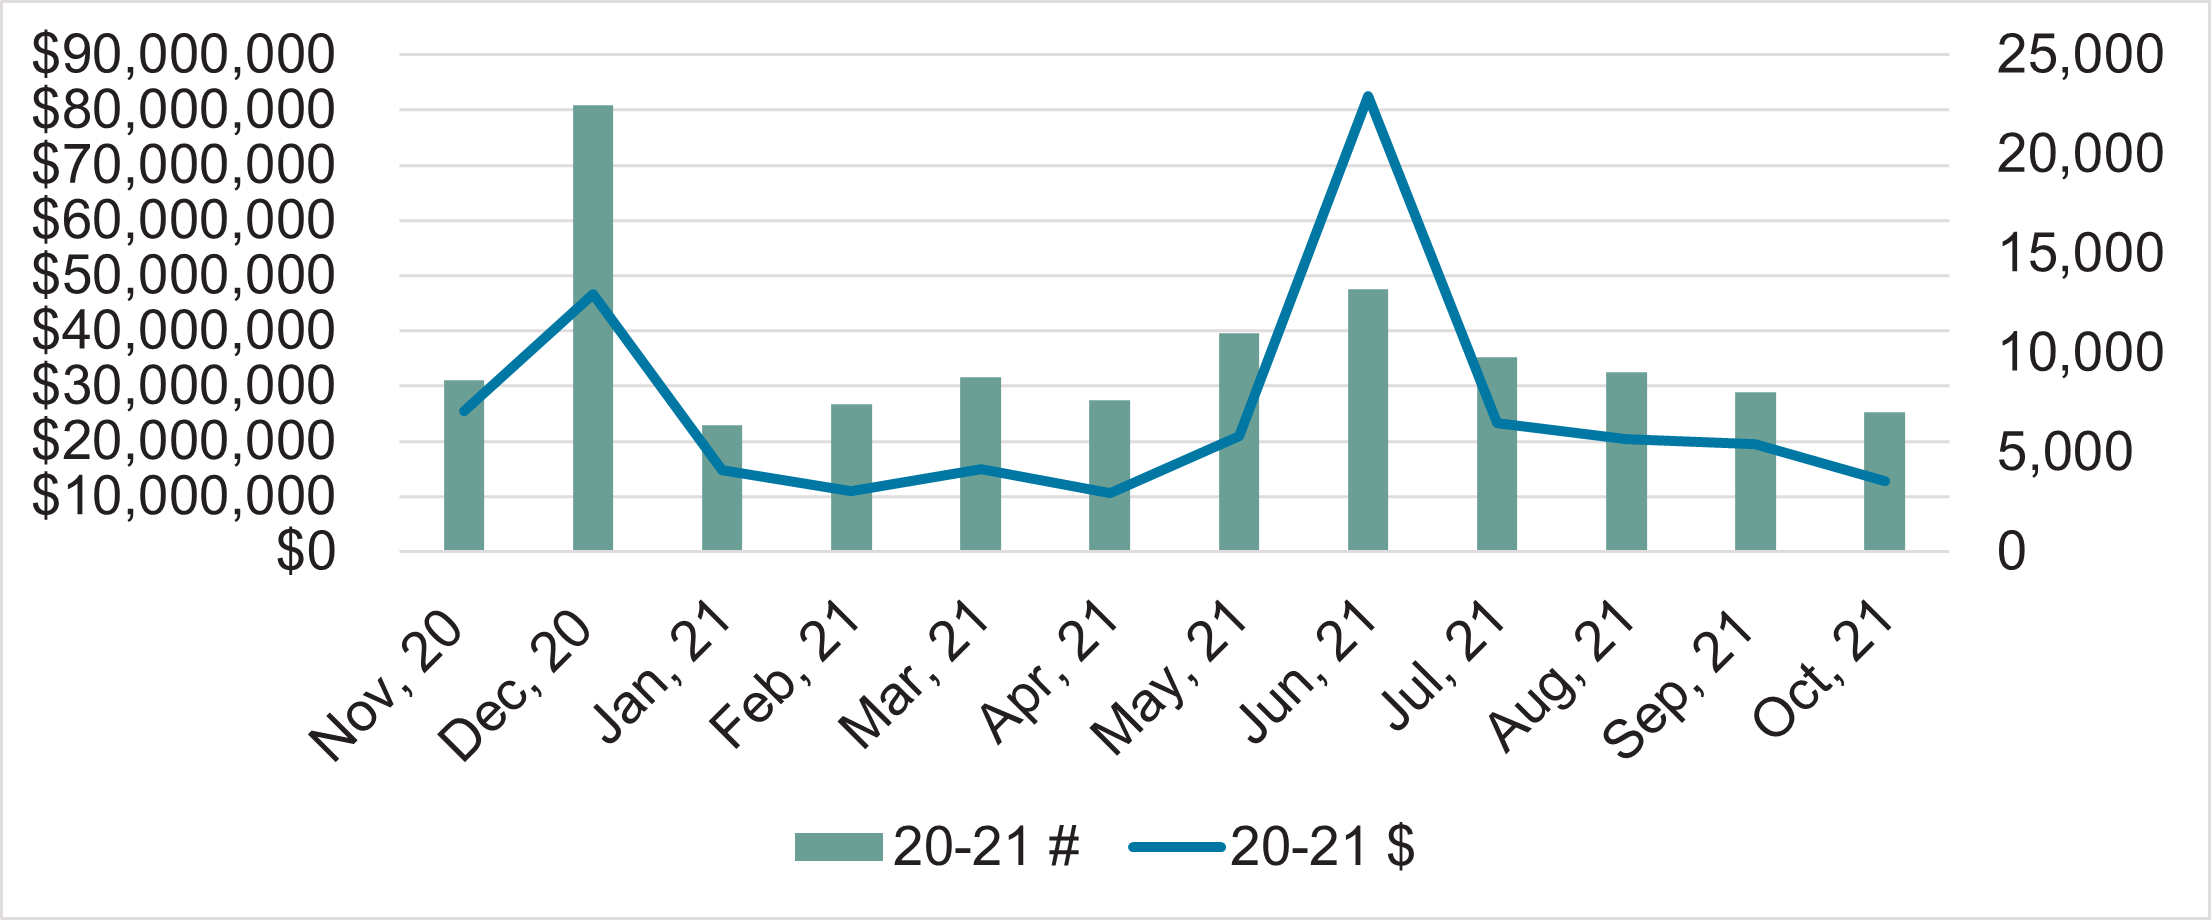
Chart 10 – Monthly donations, gifts, and revenue, Nov. 2020-Oct. 2021.
In the last 12 months, December and June have generated the largest number of gifts and revenue. These correlate with end of calendar year giving efforts and donations added-on to subscription purchases.
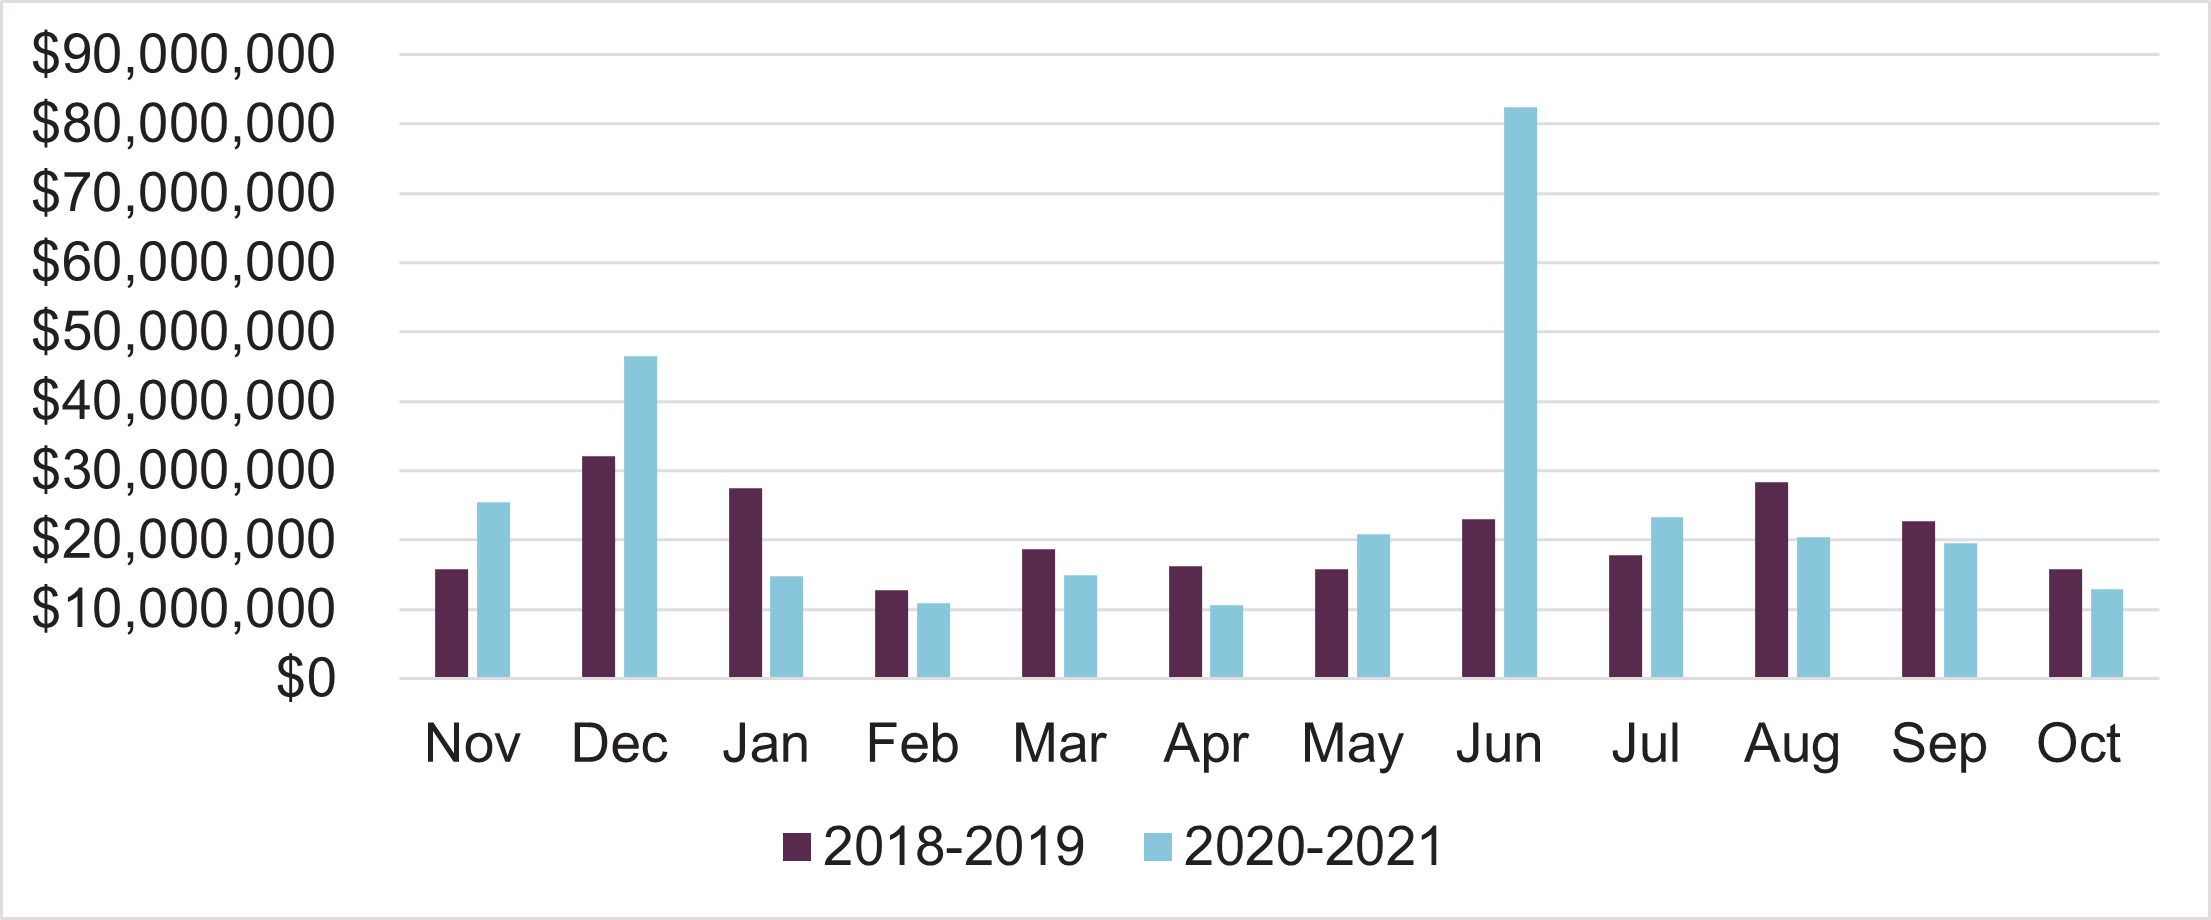
Chart 11 – Monthly donation revenue from Nov. 2020-Oct. 2021 compared to Nov. 2018-Oct. 2019.
As with arts organizations, in the last 12 months, five months have outperformed the equivalent months from 2018-2019. Also, as with arts organizations, June 2021 produced the largest gift revenue of all the months reported on this chart.
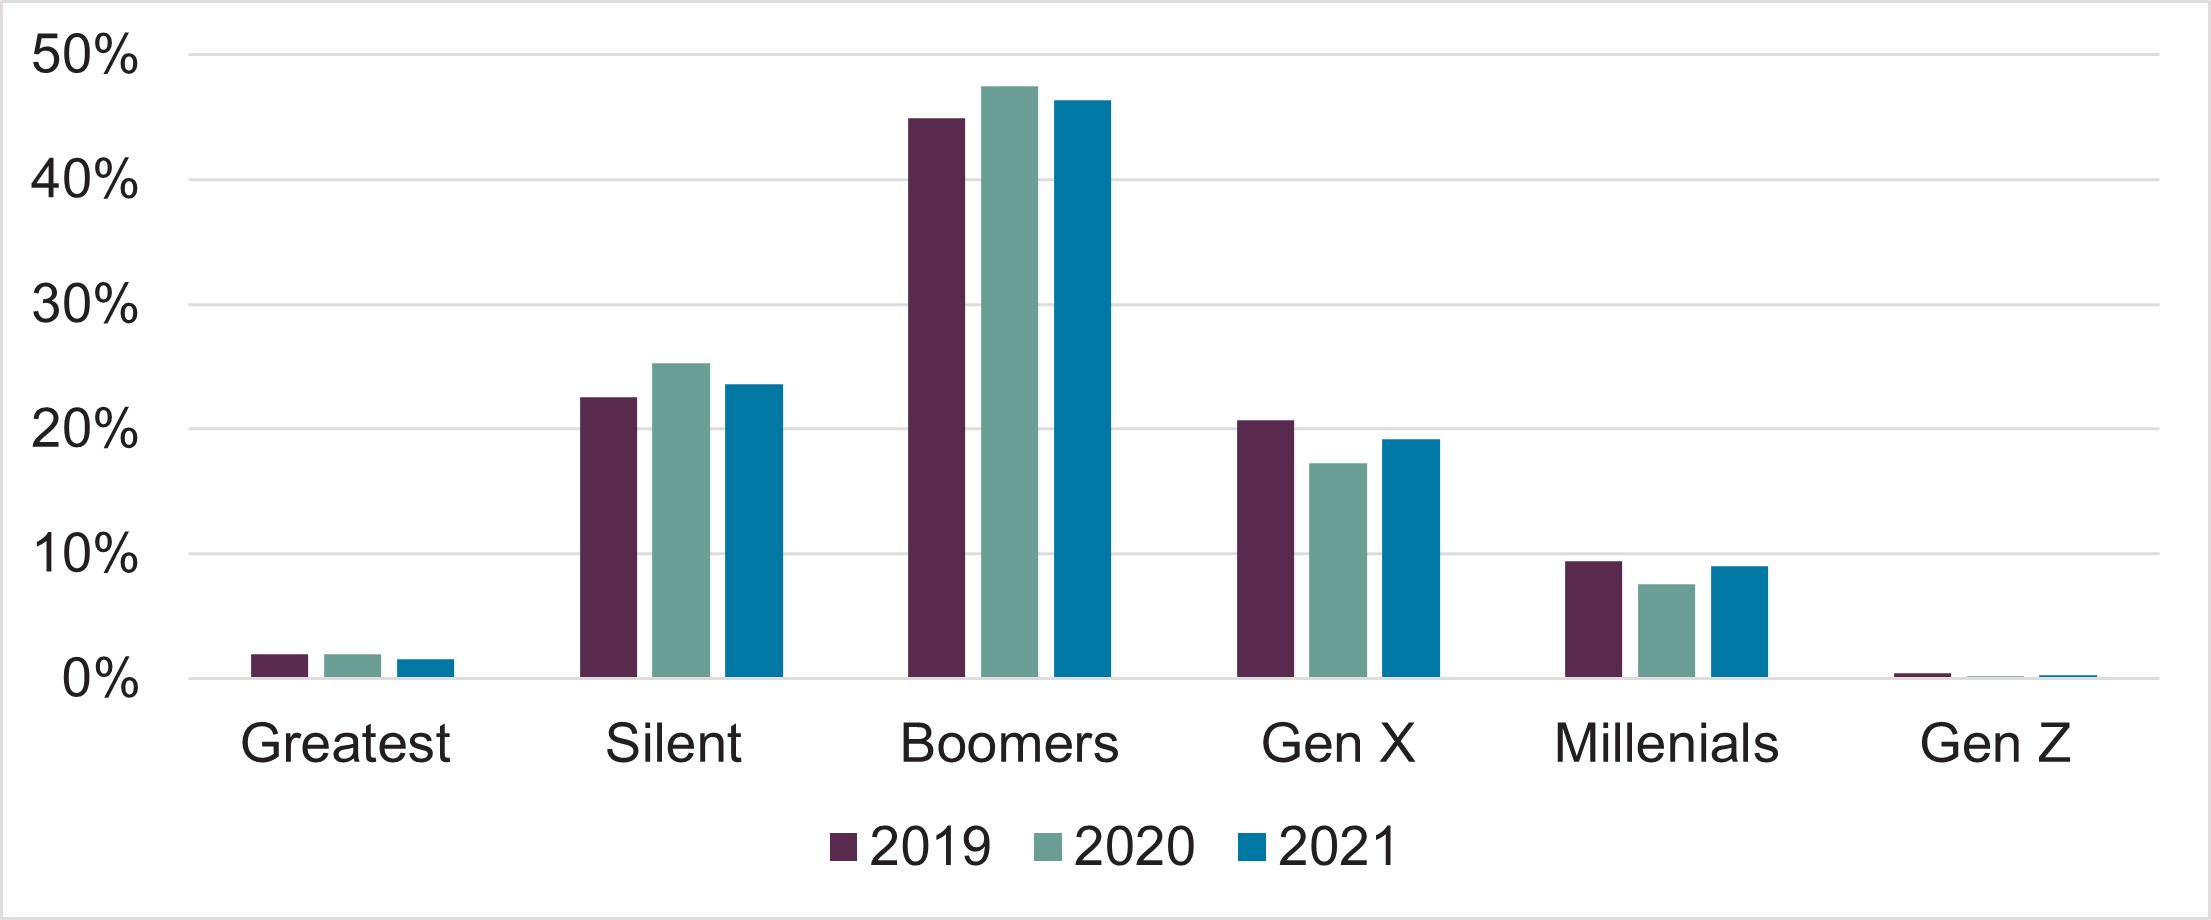
Chart 12 – Donations by generation for 2019, 2020, and 2021 to-date.
During 2020 the proportion of donations attributed to older patrons, age 55+, increased slightly while the proportion of gifts from younger audiences, under 55, decreased slightly. So far in 2021, the proportions have mostly returned to 2019 levels.
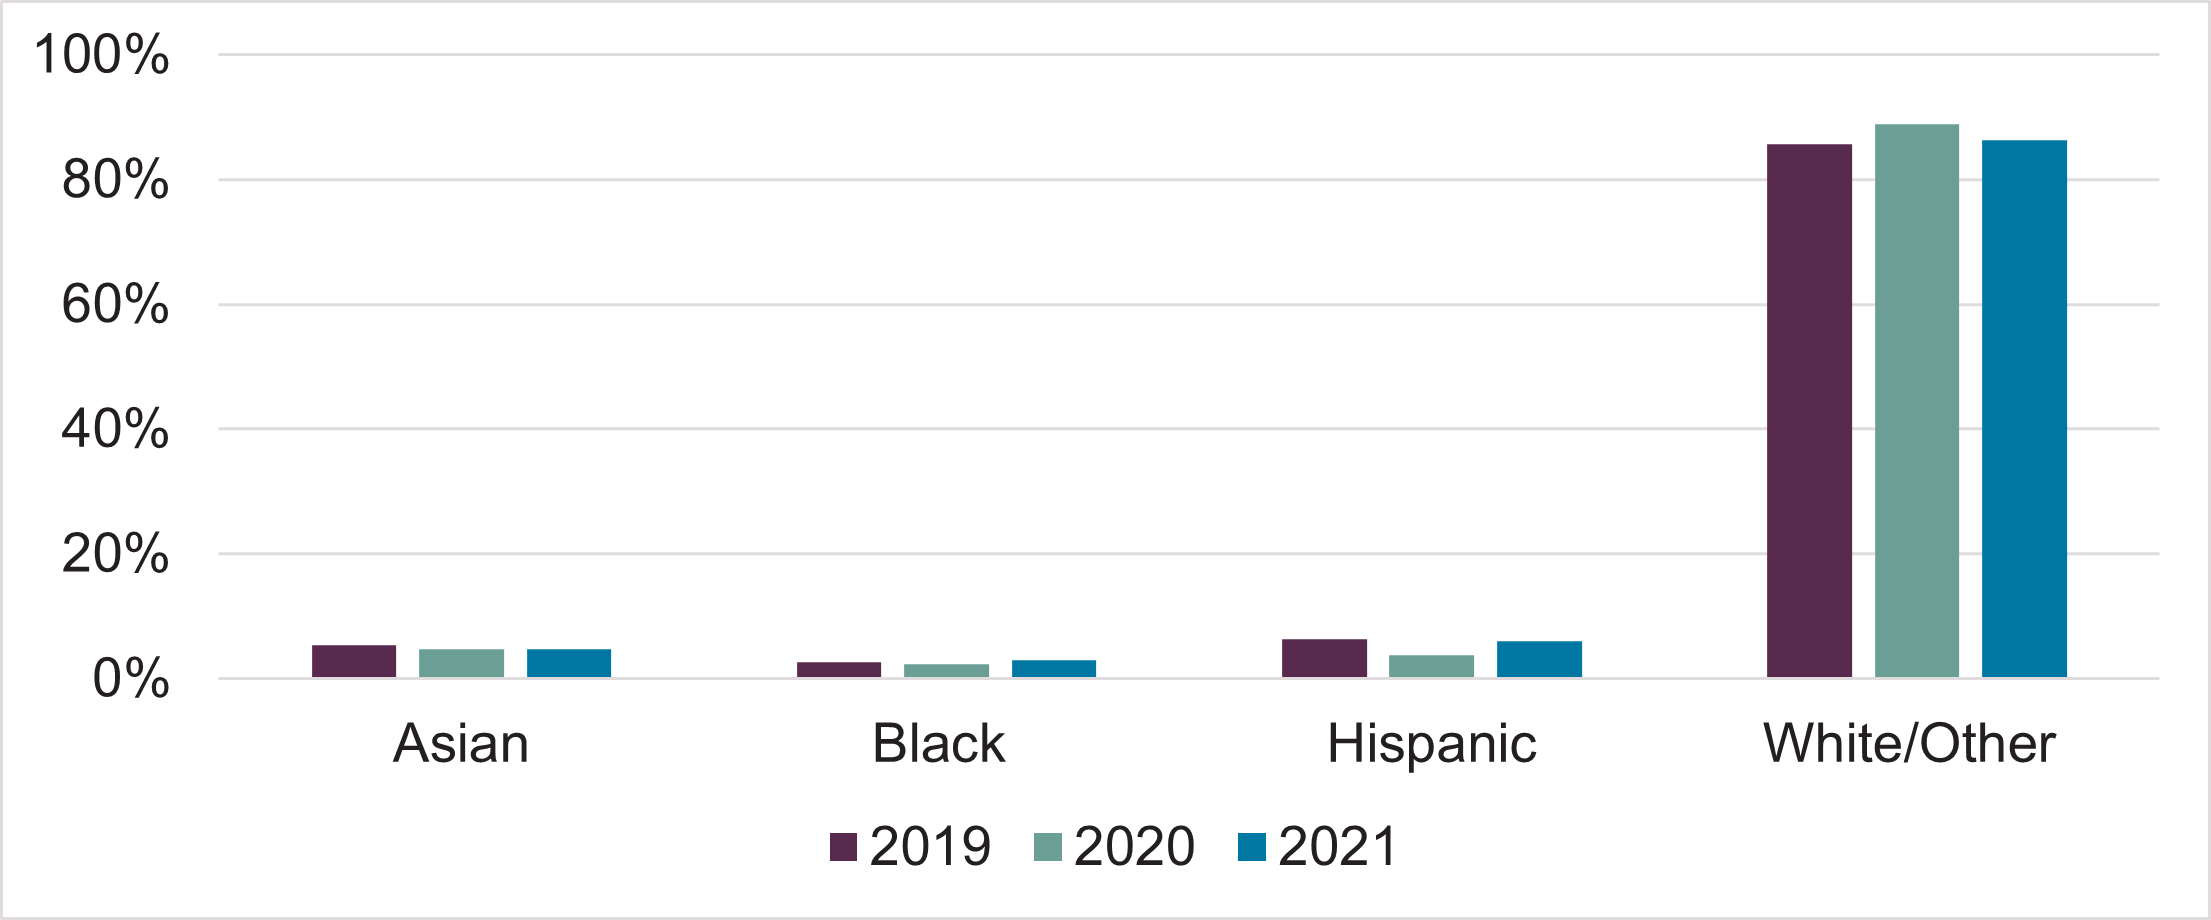
Chart 13 – Donations by ethnicity for 2019, 2020, and 2021 to-date.
During 2020 the proportion of orchestra donors became slightly less racially diverse, with the greatest contraction happening with Hispanic patrons. In 2021, this racial proportionality is much closer to that of 2019.
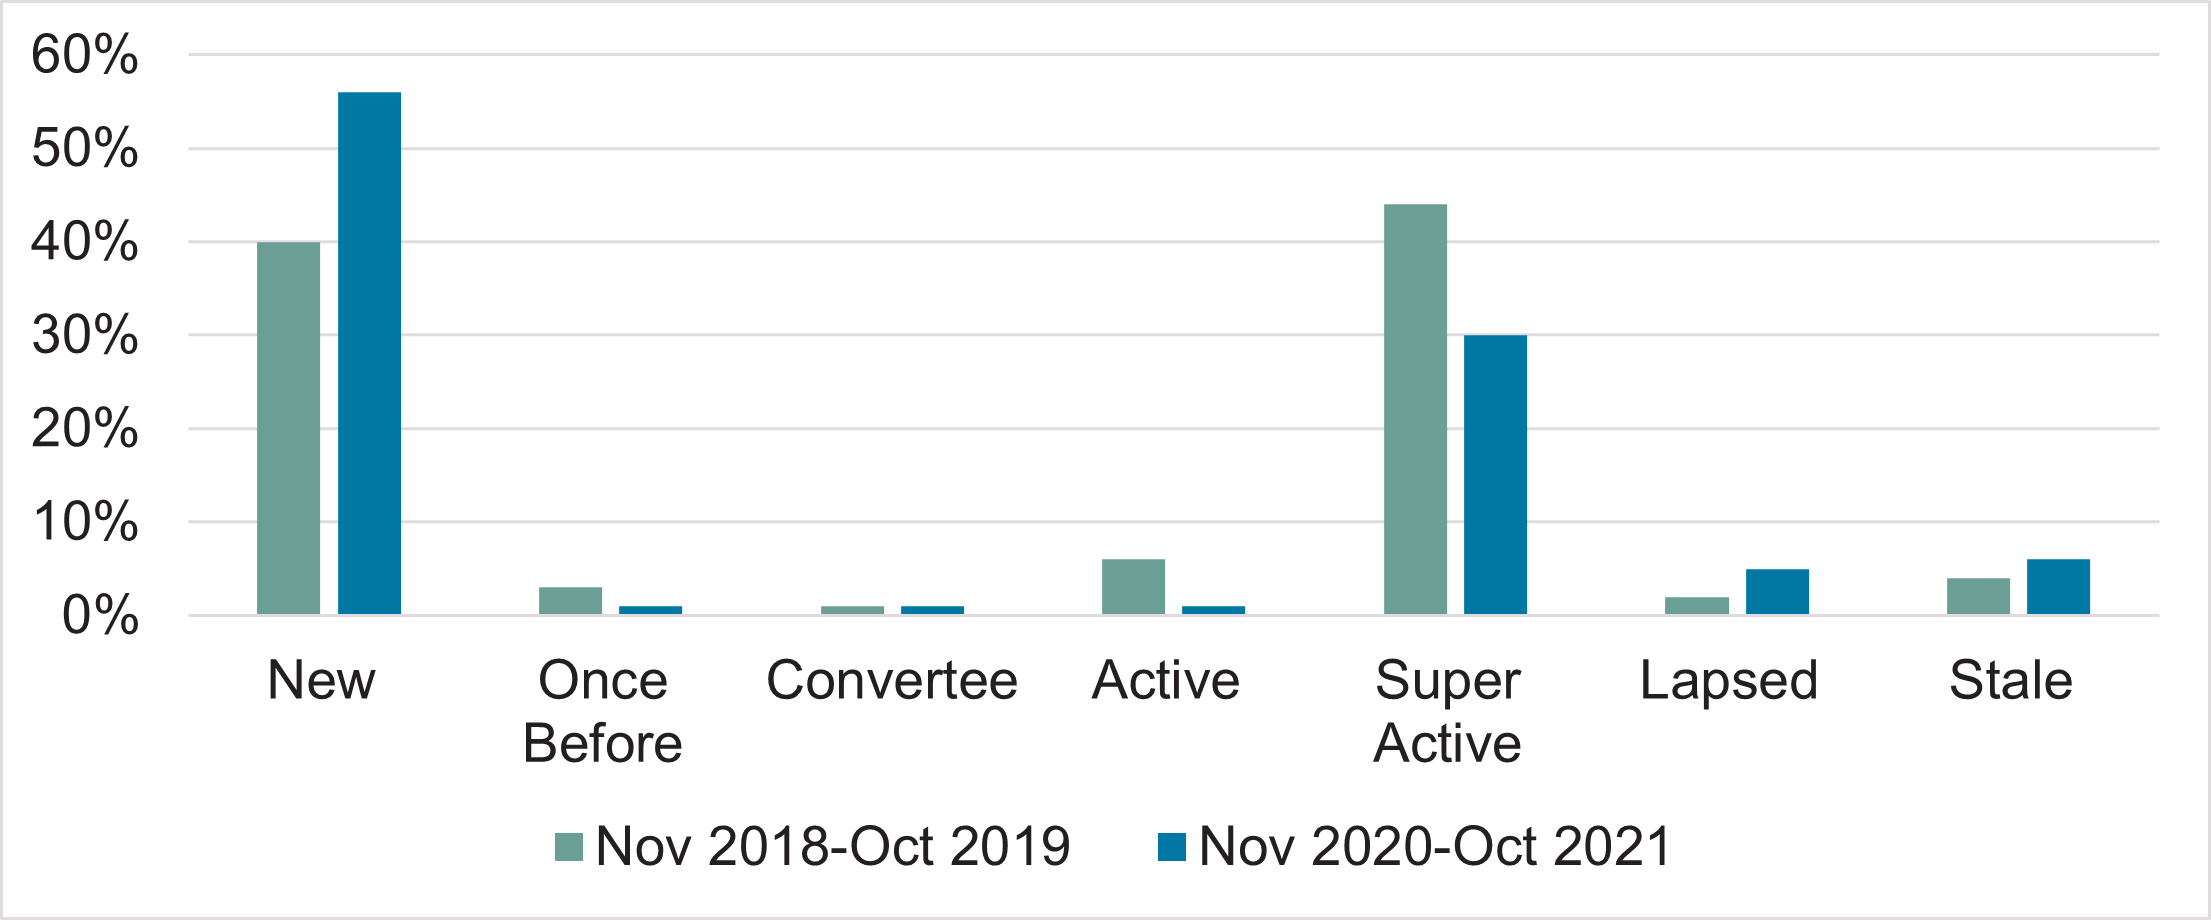
Chart 14 – Donations by patron typology, from Nov. 2018-Oct. 2019 and from Nov. 2020-Oct. 2021..
During the pandemic the proportion of gifts from patrons who are making their first financial transactions with the orchestra has grown dramatically. These “New” patrons represent the largest proportion of donors. Donations from “New” patrons and “Super Active” (highly engaged) patrons are currently the greatest producers of gift revenue. This could be the result of a wide range of factors including donation asks associated with viewing digital programming and funding mission-driven, resiliency efforts.
Conclusions
This study demonstrates there are signs of revenue recovery as orchestras, and the arts and cultural sector, return to live performances, though the recovery is still in a fragile state. External factors, such as the Delta variant, that can impact safety can also have a toll on ticket sales. Organizations should be asking themselves how they can further raise awareness of the safety measures they have in place.
Often, arts patrons are more vaccinated than other members of their communities. WolfBrown’s executive briefing from November 15, 2021 indicates that 95% of orchestra patrons who participated in The Audience Outlook Monitor survey are vaccinated. Comparatively, The New York Times reported on November 15, 2021 that 68% of Americans have received at least one vaccine dose and 59% are fully vaccinated. To help build confidence in attending for those who are worried about low vaccine rates in their communities, orchestras could consider sharing the vaccine rates of their patrons with prospective ticket buyers.
Donation revenue has increased during the pandemic both to annual funds and as payment for accessing digital programming. It is encouraging that fundraising efforts associated with mission, resiliency, and digital programming are resonating with both existing and new patrons. Organizations can capitalize on this “on-ramp” for these new patrons by creating welcome initiatives and invitations to cultivate and deepen engagement that aligns with a patron’s reason for donating
Regarding audience diversity, it is encouraging to see 2021 return to 2019 levels. There is much work to be done to continue diversifying patron bases to better reflect our communities.
While this analysis does give some grounds for optimism, the recovery is so far partial and uneven regarding ticket sales and is much more robust for donations.
For additional insights derived from the data set used to inform this report, check out SMU Data Arts’ recently published study, “When Will Arts Attendance Return?”
TRG Arts and Purple Seven are proud of The Benchmark and how it has
grown into a long-term asset for the arts and cultural sector with
expanding features and applications. Arts organizations are welcome
to join. To sign up and receive a dashboard to compare your
organization’s performance with your peers,
click here.
Scope of the Study and Assumptions
TRG Arts has observed that most cultural organizations now understand the importance of tracking and monitoring all customer activities across ticket sales and donations in a single (CRM) system, but this practice is still not universal. With the expansion to online performances, some organizations have been marketing their digital offerings through third parties rather than their own CRMs.
Organizations can also make different policy decisions on financial coding. For example, some organizations will treat a donation from a family trust as an individual gift, whereas others will treat it as a grant from a trust or foundation. There will therefore be some inconsistencies in the way that organizations treat the data that is used as the basis for this report.
It seems a reasonable assumption that while organizations may treat and code tickets and gifts differently, they are likely to maintain similar internal practices across the study period. It is however possible that disruption to standard business processes may be leading to delays or underreporting for tickets and gifts.
Regarding donations, individuals make gifts for three purposes: a capital/building project, a specific project of some other kind, or general running costs. Organizations can attribute donations to different campaigns, but it is not possible to analyze the aggregate data by these three broad types. Organizations are likely to see spikes in their contributed income in years where they are mounting capital campaigns. We cannot simply exclude these from the analysis.
Appendix:
Comparing Ticket Sales and Donations for the 125 Performing Arts Organizations and the 27 Orchestras
For the 12-month period from November 2018–October 2019, the 125 performing arts organizations sold 15,062,903 tickets for $734,045,967. Within that, the 27 orchestras sold 4,554,448 tickets for $194,083,655. In that same time frame, the 125 performing arts organizations raised 355,733 gifts for $584,183,151. Within that, the 27 orchestras raised 126,679 gifts for $246,370,406.
For the comparable 12-month period from November 2020–October 2021, those 125 performing arts organizations sold 5,278,964 tickets for $251,975,528. Within that, the 27 orchestras sold 1,514,823 tickets for $74,345,894. In that same time frame, those 125 performing arts organizations raised 337,528 gifts for $675,900,932. Within that, the 27 orchestras raised 119,305 gifts for $302,587,860.
Eric Nelson for TRG Arts
November 2021
Download a PDF of the Insight Report
This project is supported in part by the National Endowment for the Arts through our partnership with SMU DataArts.
See Your Data
Understand how your ticketing data compares to an industry leading benchmark of over 400 organisations across North America, the UK, and Ireland.
Login Now to See Your Data Join the Free Benchmark