Key Findings
- Data from 40 arts and culture organizations across 18 U.S. states reflects volume of subscription transactions is down 84% from FY20 levels; single ticket volume is down 25%.
- While total transaction volume is down, Democrat-identified households purchase arts and culture tickets at a higher rate than Republicans; this proportionality is stable across FY20 and FY21.
- COVID-era patrons purchasing are younger; Republican subscribers proportionately are less racially diverse in FY21 compared to FY20; Democrat single ticket buyers are more racially diverse.
- Subscription volume is 30% lower in blue states compared to red states, with red state subscribers skewing dramatically younger.
- Arts and culture patrons in blue states are more racially diverse than red state patrons, and more diverse than FY20 audiences.
Introduction
As the impact of the COVID-19 pandemic continues to shape and redefine the manner in which arts and culture organizations creatively serve their communities, TRG Arts has undertaken a series of research reports that seek to answer questions about the timing of the field’s return to performance as well as how COVID is shaping arts consumerism trends.
The question of “who is buying” is one that many arts and culture professionals are asking. The public health response to COVID in the United States has been decentralized and politicized. Arts and culture organizations are impacted by state and local public health decisions, causing a unique ecosystem in which there is no “normal” to report. This environment led TRG to ask: how do arts patrons’ political leanings impact their propensity to purchase during COVID?
TRG Arts studied 97,470 transactions from 40 organizations across 18 of the United States. These organizations are participating in the COVID-19 International Sector Benchmark, and reflect transactions as they exist in organizations’ CRM systems as of August 1, 2020. Organizational practices around the handling of cancelled performances in FY20 vary, and the manner in which those transactions reside in CRMs vary. Where a CRM categorizes a transaction as a valid subscription or single ticket transaction in FY20, TRG retains that categorization.
Volume of Democratic Transactions Larger, Overall Proportionality by Political Affiliation Stable
The volume of transactions for the FY21 season is dramatically lower than in FY20. In the study group, the volume of households with subscriptions in FY21 fell 84% from FY20 levels, while single tickets are down 25%. TRG suspects the latter number is artificially low, as single ticket refunds and ticket donations from FY20 may be artificially lowering the base household number. Even so, many fewer ticket transactions are occurring in FY21.
While volume is down, proportionality of transaction by political affiliation is relatively stable, as seen in Table 1. The proportion of subscription and single ticket purchases from Republicans and Democrats have shifted narrowly, between 1-2%.
Table 1: Proportion of Arts and Culture Transactions, by Political Affiliation
| Political Affiliation | FY20 Subscribers | FY21 Subscribers | Subscriber Change | FY20 Single Ticket Buyer | FY21 Single Ticket Buyer | Single Ticket Buyer Change |
|---|---|---|---|---|---|---|
| Republican | 28% | 27% | -1% | 24% | 26% | 2% |
| Democrat | 47% | 45% | -2% | 48% | 49% | -1% |
| Independent | 6% | 5% | -1% | 5% | 5% | 0% |
| No Party | 20% | 23% | 3% | 22% | 22% | 0% |
Proportionality of political affiliation may be relatively stable, but the number of households identifying as Democrats outnumber Republicans making arts and culture transactions. 18% more subscribers identified as Democrat than Republican, and 22% more single ticket buyers identified as Democrat than Republican. The number of households unaffiliated with a political party nearly matches the number of Republican households.
Table 2: Household Transactions, by Political Affiliation
| Political Affiliation | FY21 Subscriber Households | FY21 Single Ticket Households |
|---|---|---|
| Republican | 1,436 | 2,069 |
| Democrat | 2,362 | 3,880 |
| Independent | 247 | 369 |
| No Party | 1,237 | 1,781 |
All Arts Patrons Younger, Democrats More Diverse
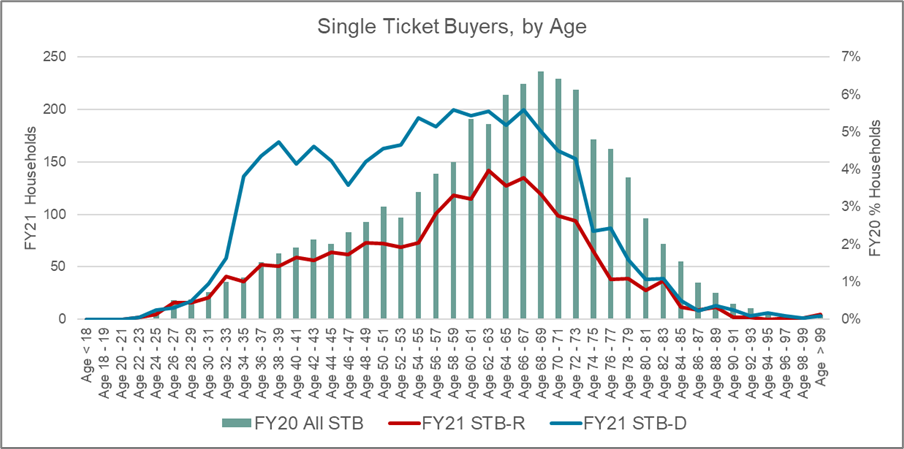
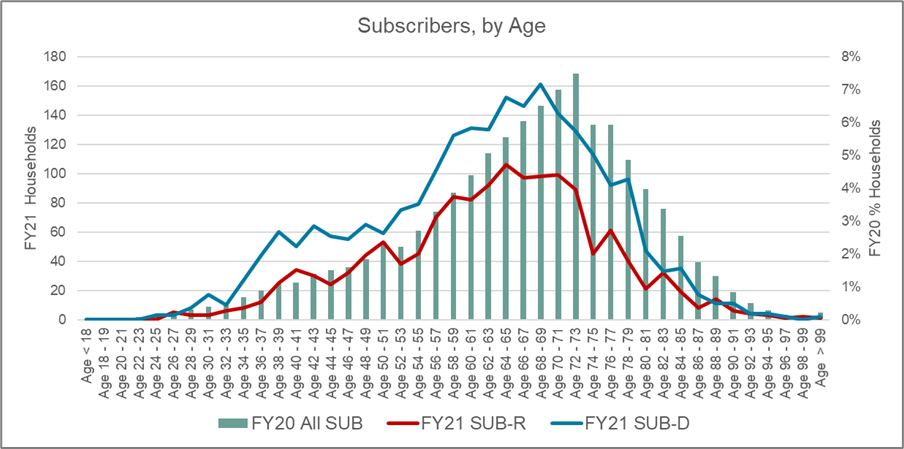
As TRG reported in August 2020, younger patrons are currently making arts and culture transactions at a higher rate than older patrons. This trend is unchanged when studying political affiliation. The proportion of arts patrons who belong to the Millennial generation and Gen X has increased significantly compared to FY20, with Democrats seeing greater shifts in both subscriptions and single ticket purchases. Significantly, single ticket proportionality has doubled for Democratic Millennials, and has grown by two-thirds for Democratic Gen Xers.
Table 3: Proportion of Arts and Culture Transactions, by Political Affiliation
| Generation | FY20 Subscribers | FY21 Republican Subscribers | FY21 Democrat Subscribers | FY20 Single Ticket Buyer | FY21 Republican Single Ticket Buyer | FY21 Democrat Single Ticket Buyer Change |
|---|---|---|---|---|---|---|
| Gen Z | 0% | 0% | 0% | 0% | 0% | 0% |
| Millennials | 4% | 4% | 7% | 7% | 11% | 14% |
| Gen X | 14% | 21% | 21% | 19% | 25% | 32% |
| Boomers | 51% | 59% | 54% | 52% | 53% | 44% |
| Silents | 29% | 16% | 18% | 20% | 11% | 8% |
| Greatest | 2% | 1% | 1% | 1% | 0% | 1% |
Chart 1: Single Ticket Buyers, by Political Affiliation

Chart 2: Subscribers, by Political Affiliation

As arts audiences in FY21 are skewing younger, shifts in the proportion of transactions – especially single ticket transactions – are occurring by race. Republican subscribers exhibit less racial diversity, while Democratic single ticket buyers have shifted the most.
Table 4: Proportion of Buyers by Race
| Race | FY20 Subscribers | FY21 Republican Subscribers | FY21 Democrat Subscribers | FY20 Single Ticket Buyer | FY21 Republican Single Ticket Buyer | FY21 Democrat Single Ticket Buyer Change |
|---|---|---|---|---|---|---|
| Asian | 2% | 1% | 2% | 2% | 2% | 3% |
| African American | 2% | 1% | 2% | 2% | 2% | 2% |
| Hispanic | 3% | 2% | 3% | 2% | 2% | 4% |
| white/Other | 93% | 96% | 93% | 94% | 94% | 91% |
Geography Important Variable Influencing Arts Consumer Trends
Certainly, many factors influence the decision to engage with arts and culture. This study reveals a person’s decision in FY21 to purchase an arts experience is being shaped more by the politics of geography than by a person’s political affiliation alone.
TRG Arts used the same data set as above and evaluated purchasing trends not along party lines, but by whether a U.S. state is a “red state” or “blue state”, as defined by the last three presidential elections
Table 5: Fast Facts - Red States, Blue States
| Red States | Blue States | |
|---|---|---|
| Total Households in FY21 | 12,536 | 10,892 |
| States Represented (# of Organizations) |
AZ (2) GA (1) IN (3) MO (1) NE (5) TN (1) TX (3) UT (1) |
CA (6) CO (3) DC (1) IL (3) MA (1) MN (1) NJ (2) NY (1) VA (2) WI (3) |
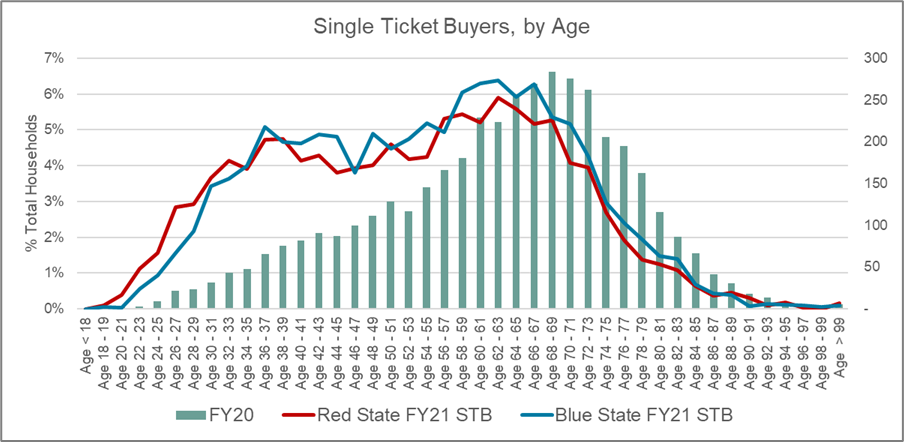
Whereas when looking at political affiliation, the volume of Democratic transactions surpassed those from Republicans, the story shifts when looking at geography by political leaning. The volume of single ticket transactions is similar across red states and blue states, with blue states having a higher proportion of transactions from Generation X and Baby Boomers. Red states have a higher proportion of single ticket transactions from Millennials.
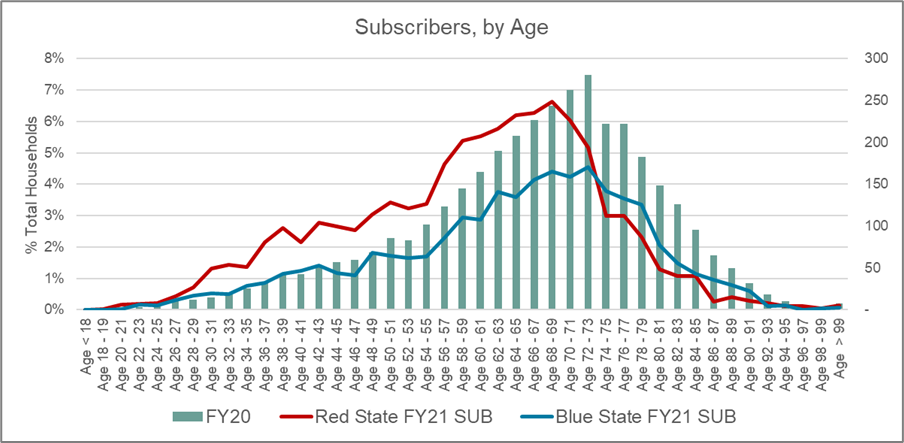
A very different behavioral trend emerges with regard to subscription transactions. The volume of blue state subscriptions is 30% lower than those from red states. Blue state subscribers closely resemble the aggregate installed subscriber base from FY20, while red state subscribers have significantly shifted proportionally younger.
Table 6: Proportion of Arts and Culture Transactions, by State Political Leaning
| Generation | FY20 Subscribers | FY21 Red State Subscribers | FY21 Blue State Subscribers | FY20 Single Ticket Buyer | FY21 Red State Single Ticket Buyer | FY21 Blue State Single Ticket Buyer Change |
|---|---|---|---|---|---|---|
| Gen Z | 0.1% | 0.2% | 0.0% | 0.1% | 0.6% | 0.1% |
| Millennials | 4% | 10% | 7% | 7% | 24% | 20% |
| Gen X | 14% | 23% | 17% | 19% | 27% | 30% |
| Boomers | 51% | 54% | 50% | 52% | 40% | 42% |
| Silents | 29% | 12% | 24% | 20% | 8% | 9% |
| Greatest | 2% | 0.8% | 1% | 1% | 0.6% | 0.4% |
Chart 3: Single Ticket Buyers, by State Political Leaning

Chart 4: Subscribers, by State Political Leaning

Just as was seen when studying transaction by political affiliation, shifts in the proportion of transactions in red states and blue states are occurring by race. Republican subscribers exhibit less racial diversity, while Democratic single ticket buyers shifted the most.
Table 4: Proportion of Buyers by Race DUPLICATE from Page 4
| Race | FY20 Subscribers | FY21 Republican Subscribers | FY21 Democrat Subscribers | FY20 Single Ticket Buyer | FY21 Republican Single Ticket Buyer | FY21 Democrat Single Ticket Buyer Change |
|---|---|---|---|---|---|---|
| Asian | 2% | 1% | 2% | 2% | 2% | 3% |
| African American | 2% | 1% | 2% | 2% | 2% | 2% |
| Hispanic | 3% | 2% | 3% | 2% | 2% | 4% |
| white/Other | 93% | 96% | 93% | 94% | 94% | 91% |
Academic Studies Illuminate Application to Arts and Culture
This data reveal that arts consumers are transacting differently during the COVID pandemic in the United States. Buyers are skewing younger, and purchasing trends suggest the political environment in which that patron resides and the patron’s political beliefs influence buying behavior. What is a leader in the field of arts and culture to do practically with this information?
Two academic studies published by the Harvard Business Review in 2018 animate these findings. The first, “How Liberals and Conservatives Shop Differently” highlights data about differing consumer motivations when making purchasing decisions. Simply, the article states conservatives favor messages showing they are better than others, while liberals favor messages showing they are unique from others.
In “The Marketing Message That Works with Republicans but Not Democrats” data show that Republicans respond to messages about preserving status, and “anxieties over…relinquishing one’s social group power or prestige in some way, can activate the status-maintenance impulse. External shocks like economic turbulence can also produce a surge in interest for conspicuous consumption… These findings suggest that the … effect may be stronger among Republicans than Democrats.”
In the rapidly changing environment of the COVID-era, TRG Arts advocates a test-and-learn approach to ensuring optimal returns for every contribution appeal and ticket sales campaign. Based on TRG research findings and the HBR research, arts and culture leaders might:
Test messaging variations.
- Test lapsed subscribers and donors with different messages, based on political affiliation. Do Republican patrons respond more highly to messages about preserving their status with your organization? Do Democrats respond more favorably to messages about how their ongoing support makes them stand apart from others during this time?
- Test acquisition segments with unique messages. Do Republican patrons respond to messages about their support in FY21 unlocking status and access for FY22? Do messages about the uniqueness of the product offering or benefits in FY21 appeal more to Democrat patrons?
Adjust existing messaging to acknowledge your local environment.
- Arts and culture leaders take the health of their artists and audiences seriously. Your audience base, however, may have more comfort with the idea of attending in-person events than organizational leaders do. How are you striking a balance between organizational and personal belief and community need and marketplace desires? How are you adapting your artistic plans to meet those market desires?
- Transparently and proactively managing patron expectations about adaptations to the in-person attendance experience – whenever that may be – can help you retain audiences. Have you been transparent about the safety measures you are or anticipate taking to ensure the safety of artists and audiences upon return? Have you committed to updating the patron base regularly on these efforts?
- For all organizations, TRG data suggest younger patrons are more likely to buy at this time. Is your messaging, packaging, and pricing strategy targeted to a younger demographic? Or is it a variation on what you’ve always done?
Older audiences are not currently transacting. Are you leaving them behind?
- Shifts to online delivery platforms may require additional technical training for audiences; and yet, FaceTime and Zoom has become a rapidly adopted medium for connecting with socially distanced families. How are you purposefully inviting older audiences to engage with online programming? Are you providing support to ensure comfort with a different delivery medium?
Ongoing Evaluation
TRG Arts is continually studying the impact of COVID-19 on the resiliency of the arts and culture field, and has made several resources free and available to all.
COVID-19 International Sector Benchmark studies live transactional data from across the globe. It allows participants to compare their patron purchase trends to geographic-specific benchmarks and is intended to be used for arts advocacy and planning. Participating organizations can learn how their recovery compares to other similar organizations.
Participation is freeThe Patron Engagement Clinic is a 2-day remote session to support the joint efforts of marketing and development staff in keeping patrons engaged.
Limited Availability: Book Now