



There are many data points that matter in running an arts or cultural organization. But, if there's one number that tells you whether your pricing strategy is working, or quietly eroding your revenue, it's per capita revenue.
It's not the flashiest metric. It probably won't make headlines in your board report. But it is, as our team put it in TRG’s Leading the Way podcast, "the canary in the coal mine."
It's the single data point that reveals whether the value exchange between your organization and your audiences is heading in the right direction.
What Is Per Capita Revenue?
Per capita revenue (or “per cap”) is, put simply, the average price paid per ticket sold. It's sometimes called “average ticket price” or “yield”, and it answers a deceptively simple question: on average, how much is each buyer spending?
The calculation is straightforward:
Per Capita Revenue = Total Ticket Revenue ÷ Number of Paid Tickets Sold
One important nuance: exclude complimentary tickets from the calculation. You want this number to reflect what paying customers are actually choosing to spend at your organization, not a diluted average that includes free allocations.
Comps deserve their own scrutiny (how many are being distributed, and in what context), but they shouldn't muddy this particular signal.
Why It Matters
Per capita revenue is a direct indicator of how your patrons are valuing the experience you offer. A rising per capita tells you demand is healthy and your pricing aligns with perceived value. A flat or d`eclining number tells you something is pulling revenue down, and you need to find out what.
But the real power of this metric isn't in any single snapshot. It's in the trend. The movement of this number over time tells you where demand actually is, far more reliably than gut instinct or anecdotal feedback.
What the Trend Reveals:
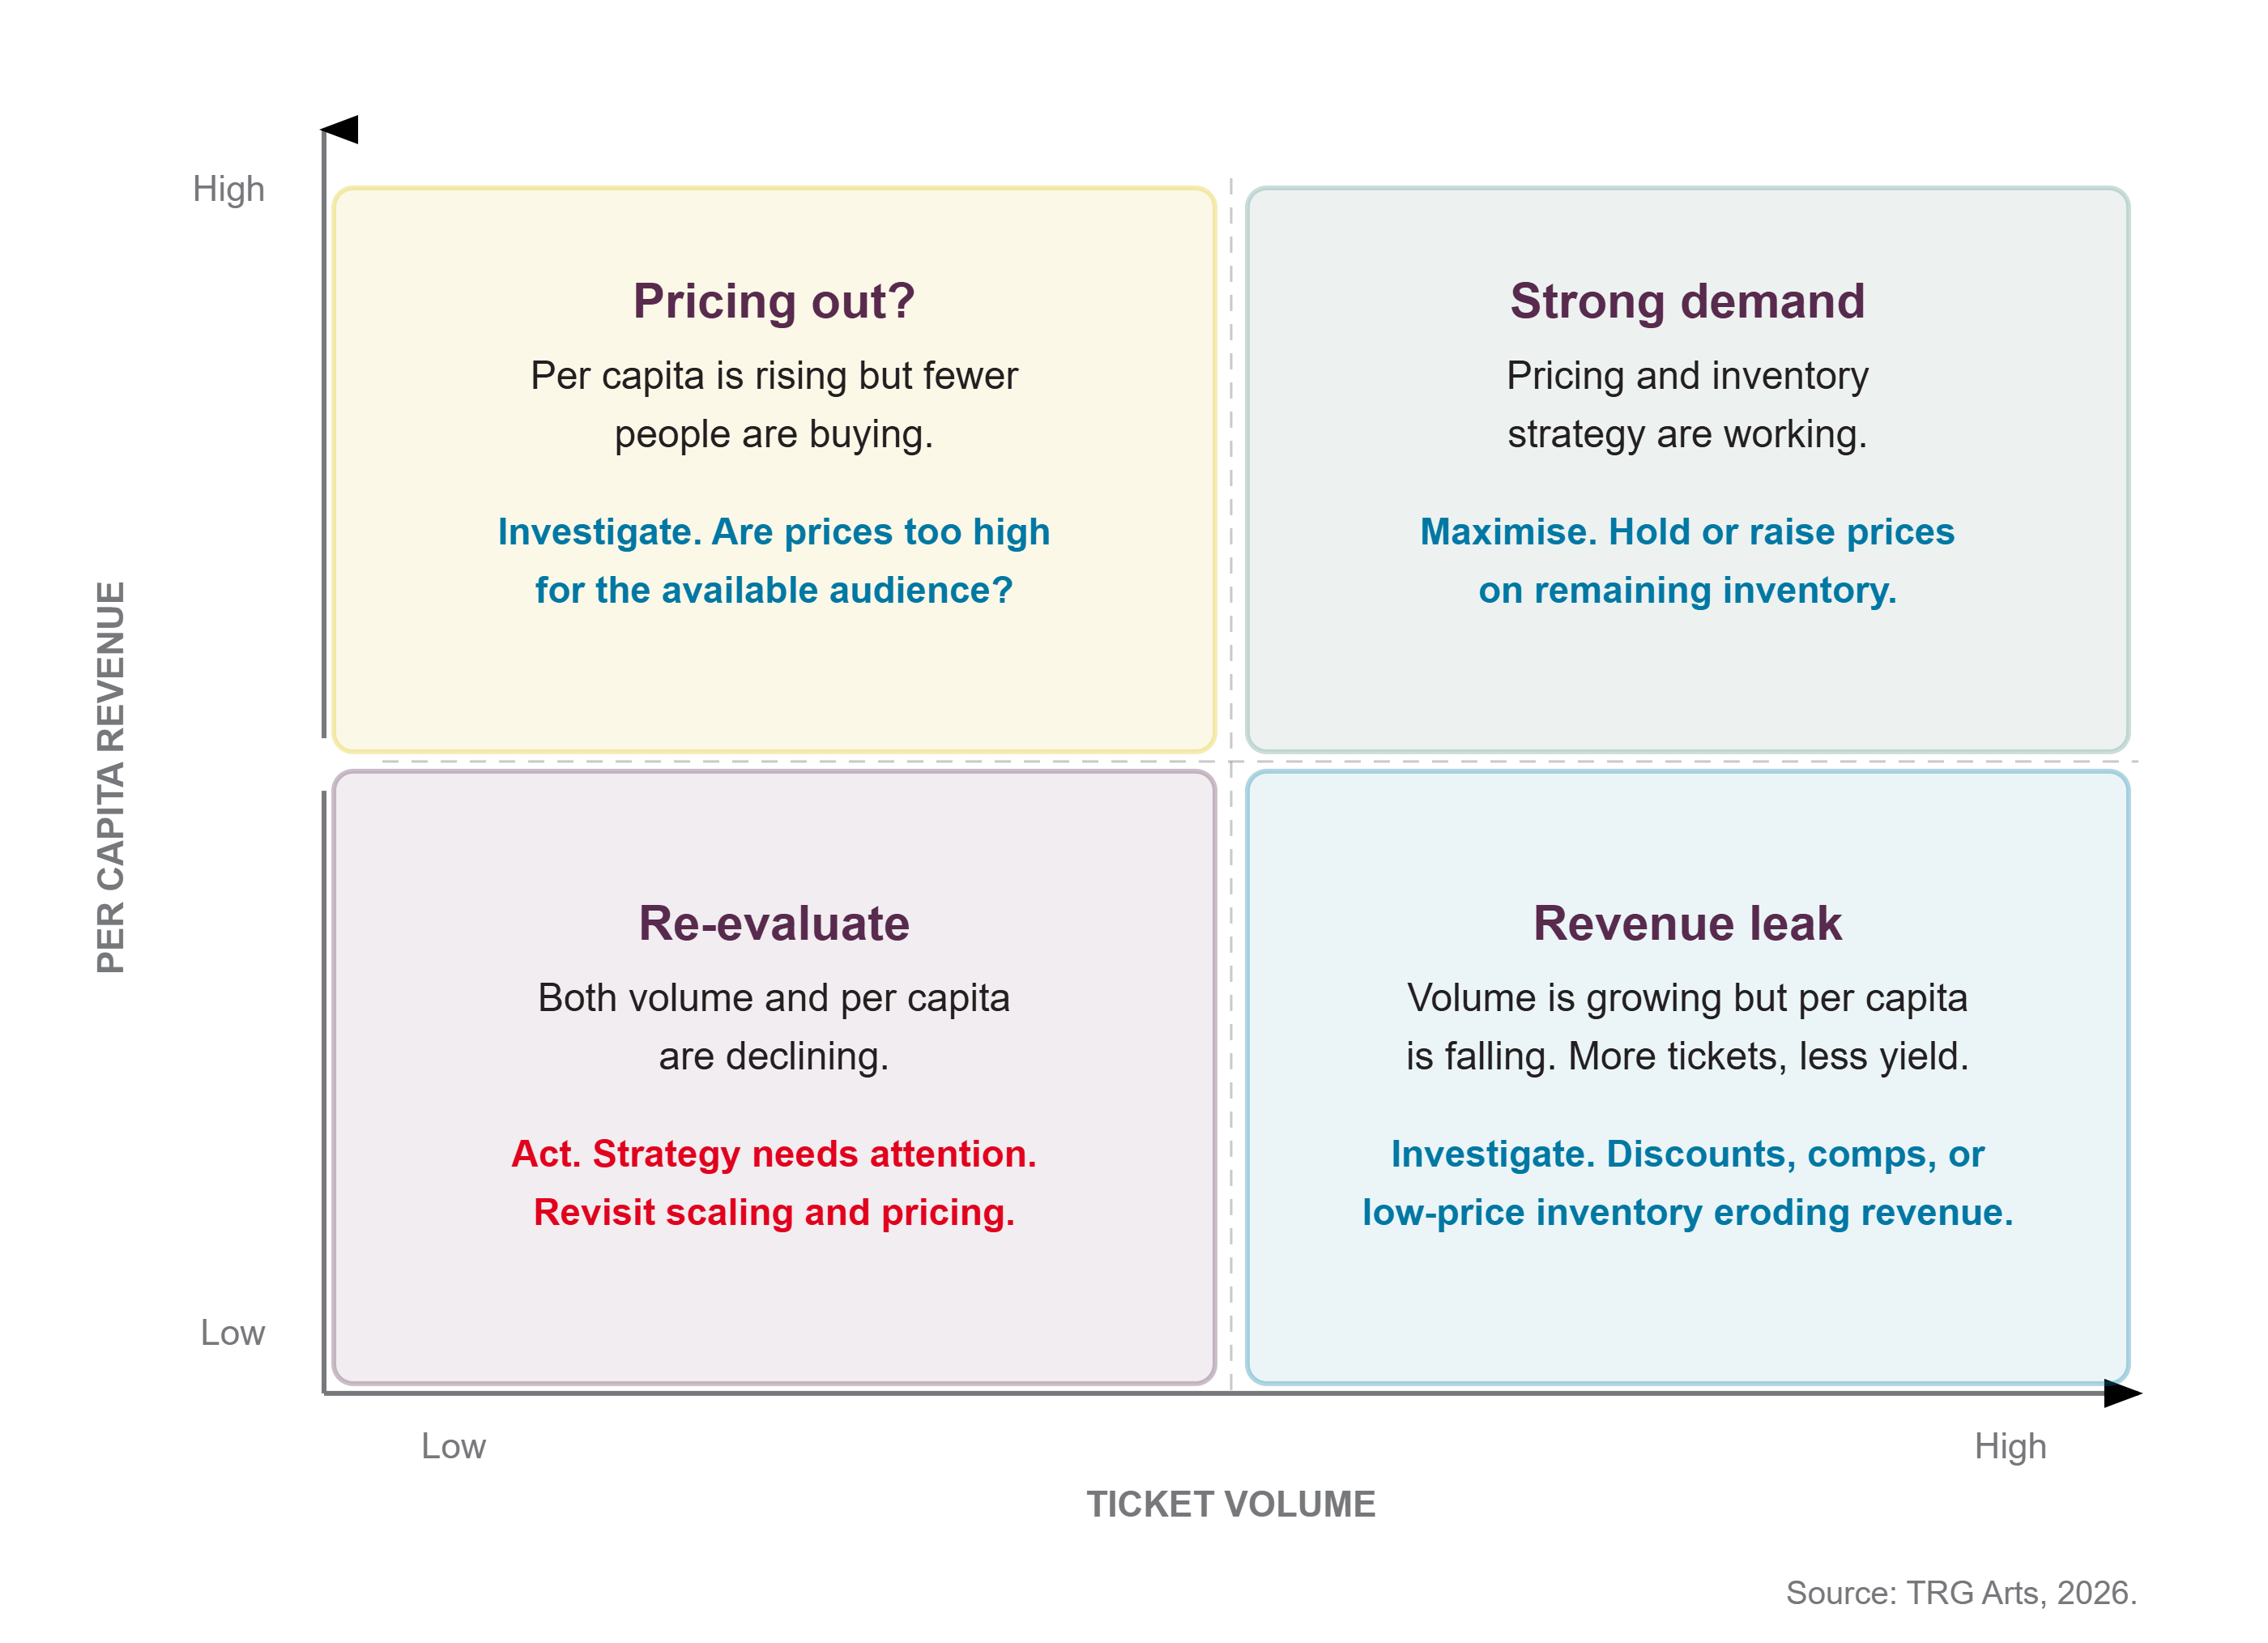
When you track per capita revenue across the sales cycle alongside ticket volume, patterns emerge quickly. You don't need sophisticated analytics. Just two data points and the relationship between them:
- Both rising together? Strong demand. Your pricing and inventory strategy are working.
- Volume rising, per cap falling? You're selling more tickets but at lower prices. Investigate: are discounts too broad? Are group sales undercutting your price structure? Is low-priced inventory dominating late-cycle sales?
- Per cap rising, volume flat? Fewer people are buying, but those who do are spending more. You may be pricing some audiences out.
- Both declining? A clear signal to re-evaluate strategy.
A Common Pattern Worth Watching
In a traditionally scaled house (lower prices at the back, higher prices toward the front, entire inventory on sale from day one), per capita revenue often declines through the sales cycle. What does that tell you?
Buyers sit on price points, clustering in the cheapest sections first. The house fills unevenly, and if you walked in at 50% sold, the experience wouldn't feel great.
Now consider the opposite: when your lowest-priced seats are the last to sell. That's a powerful demand signal. Audiences weren't price sensitive. They chose the more expensive seats first and only bought the cheaper ones when nothing else was left. You had low prices available the entire time and people passed them by. That's high demand, and if those low-price seats are all that remain at the end of the cycle, you're leaving revenue on the table.
How to Apply It
Per capita revenue isn't just something to observe. It's something to actively manage. Here's where to start:
- Track it through the full sales cycle, not just as a final result. Watch how it moves week by week alongside total volume and pacing.
- Use it to inform pricing decisions. If demand is strong and per capita is healthy, you have room to hold or raise prices on remaining inventory. If demand slows and per capita starts to dip, you can react before revenue falls off a cliff: rescale, reintroduce inventory at strategic price points, or adjust offers.
- Protect your loyal audiences. The goal isn't to push prices as high as possible. It's to ensure that as demand grows, the average cost of sale rises with it. Done well, this means your most loyal subscribers and members still get the best access and pricing early in the cycle, while your organization maximizes revenue from later buyers.
- Watch for what undermines it. Unmanaged comps, overly deep group discounts, or marketing-led discounting that the pricing team hasn't accounted for can all silently drag per capita down. If you don't have a collective way of seeing these, the metric will surprise you at the wrong moment.
Start Here
Per capita revenue won't tell you everything in isolation. But paired with volume and pacing data, it gives you enough to evaluate your strategy, spot problems early, and make informed decisions about pricing and inventory without waiting for the final box office report.
If you're not already tracking it across your sales cycle, that's your next step. The data is already telling a story. Per capita revenue is the clearest way to read it.
To hear the full conversation on demand management, dynamic pricing, and the leadership behaviors that shape revenue, listen to the full episode of Leading the Way..png?width=1280&height=720&name=What%20Your%20Average%20Ticket%20Price%20Is%20Trying%20to%20Tell%20You%20(1).png)